- Resource Library
- Math
- Data And Graphing
- Quantitative Data Analysis
- Data Representation And Analysis Concepts
Data Representation and Analysis Concepts
Interactive Video
•
Mathematics
•
9th - 10th Grade
•
Practice Problem
•
Hard

Thomas White
FREE Resource
Read more
10 questions
Show all answers
1.
MULTIPLE CHOICE QUESTION
30 sec • 1 pt
What is the primary difference between qualitative and quantitative data?
Both qualitative and quantitative data are descriptive.
Qualitative data is numerical, while quantitative data is descriptive.
Qualitative data is descriptive, while quantitative data is numerical.
Both qualitative and quantitative data are numerical.
2.
MULTIPLE CHOICE QUESTION
30 sec • 1 pt
In a histogram, what does the vertical axis represent?
The range of data values
The total number of data points
The number of occurrences for each category
The categories being measured
3.
MULTIPLE CHOICE QUESTION
30 sec • 1 pt
What is a key characteristic of a discrete histogram?
The bars do not touch each other.
The bars represent qualitative data.
The bars represent continuous data.
The bars touch each other.
4.
MULTIPLE CHOICE QUESTION
30 sec • 1 pt
In the candy taste test example, how many people rated the candy as 'very tasty'?
4 people
6 people
2 people
5 people
5.
MULTIPLE CHOICE QUESTION
30 sec • 1 pt
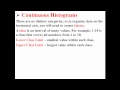
What is a 'class' in the context of continuous histograms?
A single data point
An interval of many values
A qualitative category
A type of bar graph
6.
MULTIPLE CHOICE QUESTION
30 sec • 1 pt
How is the class width determined in a continuous histogram?
By dividing the range of data by the number of classes
By adding the upper and lower class limits
By multiplying the number of classes by the range
By subtracting the upper class limit from the lower class limit
7.
MULTIPLE CHOICE QUESTION
30 sec • 1 pt
In the match burn time example, what was the approximate class width used?
10
5
15
20
Access all questions and much more by creating a free account
Create resources
Host any resource
Get auto-graded reports
Continue with Google

Continue with Email
Continue with Microsoft
or continue with

%20(1).png)
Apple
Others
Already have an account?
