Understanding Histograms and Frequency Tables
Interactive Video
•
Mathematics
•
6th - 7th Grade
•
Practice Problem
•
Hard

Thomas White
FREE Resource
10 questions
Show all answers
1.
MULTIPLE CHOICE QUESTION
30 sec • 1 pt
What is the main focus of the lesson introduced in the video?
Bar charts and pie charts
Line graphs and scatter plots
Histograms and frequency tables
Pie charts and line graphs
2.
MULTIPLE CHOICE QUESTION
30 sec • 1 pt
What does each tally mark in a frequency table represent?
Five data points
Two data points
One data point
Ten data points
3.
MULTIPLE CHOICE QUESTION
30 sec • 1 pt
What is one advantage of using a frequency table?
It shows the exact price of each item
It provides a 3D view of data
It helps identify specific average ticket prices
It displays data in a circular format
4.
MULTIPLE CHOICE QUESTION
30 sec • 1 pt
What is a histogram primarily used for?
Displaying categorical data
Illustrating data trends over time
Comparing two different datasets
Showing numerical data organized into intervals
5.
MULTIPLE CHOICE QUESTION
30 sec • 1 pt
How are the intervals in a histogram described?
They are circular
They are random
They vary in size
They are constant and equal
6.
MULTIPLE CHOICE QUESTION
30 sec • 1 pt
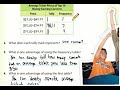
In the example, how many remote control airplanes cost less than $75?
16
9
7
3
7.
MULTIPLE CHOICE QUESTION
30 sec • 1 pt
How many remote control airplanes cost at least $100?
4
3
2
1
Access all questions and much more by creating a free account
Create resources
Host any resource
Get auto-graded reports
Continue with Google

Continue with Email
Continue with Microsoft
or continue with

%20(1).png)
Apple
Others
Already have an account?
