Graphing Inequalities and Interval Notation
Interactive Video
•
Mathematics
•
9th - 10th Grade
•
Practice Problem
•
Hard

Lucas Foster
FREE Resource
Read more
10 questions
Show all answers
1.
MULTIPLE CHOICE QUESTION
30 sec • 1 pt
Why is graphing considered the best method for solving certain inequalities?
It is the fastest method.
It provides a visual representation that is easy to interpret.
It is the only method available.
It requires no calculations.
2.
MULTIPLE CHOICE QUESTION
30 sec • 1 pt
What is the first step in graphing the left-hand side of an inequality?
Finding the y-intercept.
Solving the inequality algebraically.
Factorizing the expression.
Drawing the graph directly.
3.
MULTIPLE CHOICE QUESTION
30 sec • 1 pt
How do you determine the x-intercepts of a polynomial?
By setting x to zero and solving for y.
By using a calculator.
By finding the derivative.
By setting y to zero and solving for x.
4.
MULTIPLE CHOICE QUESTION
30 sec • 1 pt
What happens to the graph of a polynomial as x approaches a very large negative value?
The graph becomes very steep and negative.
The graph levels off.
The graph becomes a straight line.
The graph approaches zero.
5.
MULTIPLE CHOICE QUESTION
30 sec • 1 pt
What is a turning point in the context of graphing polynomials?
A point where the graph intersects the y-axis.
A point where the graph becomes a straight line.
A point where the graph changes direction.
A point where the graph crosses the x-axis.
6.
MULTIPLE CHOICE QUESTION
30 sec • 1 pt
When interpreting a graph, what does it mean for the graph to be 'below the axis'?
The graph is above the x-axis.
The graph is below the x-axis.
The graph is above the y-axis.
The graph is below the y-axis.
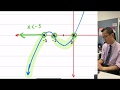
7.
MULTIPLE CHOICE QUESTION
30 sec • 1 pt
Which x-values correspond to the sections of the graph that are below the x-axis?
x > 0
x < -3 and -2 < x < 0
x < 0
x > 3
Access all questions and much more by creating a free account
Create resources
Host any resource
Get auto-graded reports
Continue with Google

Continue with Email
Continue with Microsoft
or continue with

%20(1).png)
Apple
Others
Already have an account?
