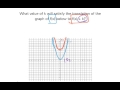
Graph Translations and Value of K
Interactive Video
•
Mathematics
•
9th - 10th Grade
•
Practice Problem
•
Hard

Lucas Foster
FREE Resource
Read more
5 questions
Show all answers
1.
MULTIPLE CHOICE QUESTION
30 sec • 1 pt
What is the initial problem discussed in the video?
Finding the slope of a line
Identifying the x-intercept of a graph
Determining the value of K for graph translation
Calculating the area under a curve
2.
MULTIPLE CHOICE QUESTION
30 sec • 1 pt
How does the graph of f(x) + K compare to the graph of f(x)?
It is a rotation around the origin
It is a vertical shift
It is a horizontal shift
It is a reflection over the x-axis
3.
MULTIPLE CHOICE QUESTION
30 sec • 1 pt
What indicates that the value of K is positive?
The graph shifts to the left
The graph remains unchanged
The graph shifts downwards
The graph shifts upwards
4.
MULTIPLE CHOICE QUESTION
30 sec • 1 pt
By how many units does the graph shift to determine the value of K?
5 units
7 units
3 units
10 units
5.
MULTIPLE CHOICE QUESTION
30 sec • 1 pt
What is the final value of K that translates the graph?
K = 5
K = -5
K = 10
K = 0
Access all questions and much more by creating a free account
Create resources
Host any resource
Get auto-graded reports
Continue with Google

Continue with Email
Continue with Classlink
Continue with Clever
or continue with
Microsoft
%20(1).png)
Apple
Others
Already have an account?
