Understanding Y-Intercept in Graphs
Interactive Video
•
Mathematics
•
9th - 10th Grade
•
Practice Problem
•
Hard

Aiden Montgomery
FREE Resource
Read more
7 questions
Show all answers
1.
MULTIPLE CHOICE QUESTION
30 sec • 1 pt
What does the Y-intercept of a graph typically represent?
The midpoint of the graph
The rate of change over time
The starting value before any changes occur
The ending value of the graph
2.
MULTIPLE CHOICE QUESTION
30 sec • 1 pt
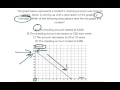
In the context of the checking account graph, what does the Y-intercept of $200 signify?
The account balance after 10 weeks
The final balance in the account
The initial amount in the account
The total amount withdrawn
3.
MULTIPLE CHOICE QUESTION
30 sec • 1 pt
Why is the statement 'The checking account decreases by $20 each week' not related to the Y-intercept?
Because the Y-intercept is irrelevant to the graph
Because the Y-intercept represents the starting amount, not the rate of decrease
Because the Y-intercept changes over time
Because the Y-intercept is the final amount
4.
MULTIPLE CHOICE QUESTION
30 sec • 1 pt
What does the Y-intercept not indicate in the context of the checking account graph?
The amount before any time has passed
The initial balance
The rate at which the account decreases
The starting point of the graph
5.
MULTIPLE CHOICE QUESTION
30 sec • 1 pt
Why is the statement 'The account decreases to $0 in 10 years' incorrect regarding the Y-intercept?
Because the Y-intercept is about the midpoint of the graph
Because the Y-intercept is about the starting amount, not the time to reach zero
Because the Y-intercept is about the rate of decrease
Because the Y-intercept is about the ending amount
6.
MULTIPLE CHOICE QUESTION
30 sec • 1 pt
What is the final balance of the checking account according to the graph?
$0
$200
$50
$100
7.
MULTIPLE CHOICE QUESTION
30 sec • 1 pt
Which statement is true about the Y-intercept in the context of the checking account graph?
It indicates the rate of decrease in the account
It represents the final balance of the account
It marks the midpoint of the account balance
It shows the initial amount before any withdrawals
Access all questions and much more by creating a free account
Create resources
Host any resource
Get auto-graded reports
Continue with Google

Continue with Email
Continue with Microsoft
or continue with

%20(1).png)
Apple
Others
Already have an account?
