Graph Interpretation and Analysis
Interactive Video
•
Mathematics
•
6th - 7th Grade
•
Practice Problem
•
Hard

Olivia Brooks
FREE Resource
Read more
9 questions
Show all answers
1.
MULTIPLE CHOICE QUESTION
30 sec • 1 pt
What is the importance of assuming that the scales on a graph are chosen appropriately?
It means the graph is not important.
It helps in making accurate assumptions about the data.
It allows us to ignore the graph entirely.
It suggests the graph is incorrect.
2.
MULTIPLE CHOICE QUESTION
30 sec • 1 pt
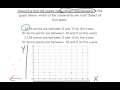
What is the range of the x-axis in the given graph?
10 to 20
5 to 15
0 to 10
0 to 5
3.
MULTIPLE CHOICE QUESTION
30 sec • 1 pt
Why is statement A considered a possible answer?
Because all points are between 0 and 10 on the x-axis.
Because the graph is not visible.
Because the x-axis is not important.
Because some points are outside the visible range.
4.
MULTIPLE CHOICE QUESTION
30 sec • 1 pt
What does statement B suggest about the x-axis?
Some points are between -10 and 0.
All points are below 0.
All points are above 10.
Some points are between 0 and 10.
5.
MULTIPLE CHOICE QUESTION
30 sec • 1 pt
Why is statement B crossed out?
Because it is not related to the graph.
Because it is not a statement.
Because it is the correct answer.
Because it suggests points are outside the visible range.
6.
MULTIPLE CHOICE QUESTION
30 sec • 1 pt
What is the range of the y-axis in the given graph?
0 to 10
10 to 20
5 to 15
0 to 5
7.
MULTIPLE CHOICE QUESTION
30 sec • 1 pt
Why is statement C considered correct?
Because all points are between 0 and 10 on the y-axis.
Because the graph is incorrect.
Because some points are outside the visible range.
Because the y-axis is not important.
Access all questions and much more by creating a free account
Create resources
Host any resource
Get auto-graded reports
Continue with Google

Continue with Email
Continue with Classlink
Continue with Clever
or continue with
Microsoft
%20(1).png)
Apple
Others
Already have an account?
Popular Resources on Wayground

15 questions
Fractions on a Number Line
Quiz
•
3rd Grade
20 questions
Equivalent Fractions
Quiz
•
3rd Grade
25 questions
Multiplication Facts
Quiz
•
5th Grade
54 questions
Analyzing Line Graphs & Tables
Quiz
•
4th Grade
22 questions
fractions
Quiz
•
3rd Grade
20 questions
Main Idea and Details
Quiz
•
5th Grade
20 questions
Context Clues
Quiz
•
6th Grade
15 questions
Equivalent Fractions
Quiz
•
4th Grade
Discover more resources for Mathematics
22 questions
distributive property
Quiz
•
7th Grade
18 questions
Angle Relationships
Quiz
•
7th Grade
15 questions
Distributive Property & Review
Quiz
•
6th Grade
20 questions
Writing Algebraic Expressions
Quiz
•
6th Grade
20 questions
How Some Friendships Last — and Others Don’t Video Questions
Quiz
•
7th Grade
20 questions
Ratios/Rates and Unit Rates
Quiz
•
6th Grade
18 questions
Handbook Refresher Quiz
Quiz
•
7th Grade
20 questions
Graphing Inequalities on a Number Line
Quiz
•
6th - 9th Grade