TV Watching vs Study Time Analysis
Interactive Video
•
Other
•
9th - 10th Grade
•
Practice Problem
•
Hard

Lucas Foster
FREE Resource
Read more
5 questions
Show all answers
1.
MULTIPLE CHOICE QUESTION
30 sec • 1 pt
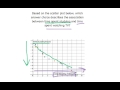
What are the two variables being compared in the scatter plot?
Time spent studying and time spent exercising
Time spent studying and time spent watching TV
Time spent watching TV and time spent sleeping
Time spent exercising and time spent watching TV
2.
MULTIPLE CHOICE QUESTION
30 sec • 1 pt
On which axis is the time spent studying represented?
X-axis
Z-axis
Y-axis
None of the above
3.
MULTIPLE CHOICE QUESTION
30 sec • 1 pt
What happens to the time spent studying as the time spent watching TV increases?
It decreases
It remains the same
It fluctuates randomly
It increases
4.
MULTIPLE CHOICE QUESTION
30 sec • 1 pt
How is the relationship between time spent watching TV and time spent studying described?
Random association
Negative association
No association
Positive association
5.
MULTIPLE CHOICE QUESTION
30 sec • 1 pt
Which of the following best describes the trend observed in the scatter plot?
There is no clear trend
As TV watching time increases, study time increases
As TV watching time increases, study time decreases
As TV watching time decreases, study time decreases
Access all questions and much more by creating a free account
Create resources
Host any resource
Get auto-graded reports
Continue with Google

Continue with Email
Continue with Classlink
Continue with Clever
or continue with
Microsoft
%20(1).png)
Apple
Others
Already have an account?
Similar Resources on Wayground

6 questions
CLEAN : Liberia war crimes trial resumes in Finland
Interactive video
•
9th - 12th Grade
6 questions
CLEAN : Fears for Turkey ballot as Kurdish conflict deepens
Interactive video
•
10th - 12th Grade
6 questions
CLEAN : Syria drone strike kills suspected IS member
Interactive video
•
9th - 10th Grade
6 questions
Hauliers block Dublin port calling for Transport Minister's resignation
Interactive video
•
9th - 10th Grade
6 questions
Fidelity's Yeung: Value Can Be Found Across All Sectors in China
Interactive video
•
11th - 12th Grade
2 questions
New Zealand lifestyle
Interactive video
•
9th - 10th Grade
6 questions
CLEAN : Kenya building collapse toll rises to 26
Interactive video
•
9th - 10th Grade
Popular Resources on Wayground
15 questions
Fractions on a Number Line
Quiz
•
3rd Grade
20 questions
Equivalent Fractions
Quiz
•
3rd Grade
25 questions
Multiplication Facts
Quiz
•
5th Grade
54 questions
Analyzing Line Graphs & Tables
Quiz
•
4th Grade
22 questions
fractions
Quiz
•
3rd Grade
20 questions
Main Idea and Details
Quiz
•
5th Grade
20 questions
Context Clues
Quiz
•
6th Grade
15 questions
Equivalent Fractions
Quiz
•
4th Grade
Discover more resources for Other
20 questions
El Verbo IR Practice
Quiz
•
9th Grade
20 questions
-AR -ER -IR present tense
Quiz
•
10th - 12th Grade
10 questions
Understanding Meiosis
Interactive video
•
6th - 10th Grade
20 questions
Graphing Inequalities on a Number Line
Quiz
•
6th - 9th Grade
15 questions
Making Inferences
Quiz
•
7th - 12th Grade
18 questions
SAT Prep: Ratios, Proportions, & Percents
Quiz
•
9th - 10th Grade
15 questions
Main Idea and Supporting Details.
Quiz
•
4th - 11th Grade
12 questions
Exponential Growth and Decay
Quiz
•
9th Grade