Impact of Absences on Exam Scores
Interactive Video
•
Mathematics
•
9th - 10th Grade
•
Practice Problem
•
Hard

Lucas Foster
FREE Resource
Read more
7 questions
Show all answers
1.
MULTIPLE CHOICE QUESTION
30 sec • 1 pt
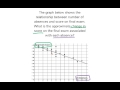
What does the graph primarily illustrate?
The relationship between homework completion and test scores.
The relationship between class participation and grades.
The relationship between absences and final exam scores.
The relationship between study hours and exam scores.
2.
MULTIPLE CHOICE QUESTION
30 sec • 1 pt
On which axis is the final exam score plotted?
None of the above
X-axis
Y-axis
Z-axis
3.
MULTIPLE CHOICE QUESTION
30 sec • 1 pt
What does an increase in the number of absences by one unit represent on the graph?
No change in the graph.
A diagonal shift in the graph.
A horizontal shift in the graph.
A vertical shift in the graph.
4.
MULTIPLE CHOICE QUESTION
30 sec • 1 pt
What is the approximate change in the exam score when absences increase from 35 to 33?
Increase by 3 points
Increase by 2 points
Decrease by 3 points
Decrease by 2 points
5.
MULTIPLE CHOICE QUESTION
30 sec • 1 pt
What is the observed pattern in the change of exam scores with each absence?
The score decreases by 2 points.
The score increases by 2 points.
The score decreases by 3 points.
The score remains the same.
6.
MULTIPLE CHOICE QUESTION
30 sec • 1 pt
How does the score change when absences increase from 34 to 32?
The score decreases by 2 points.
The score decreases by 3 points.
The score increases by 2 points.
The score increases by 3 points.
7.
MULTIPLE CHOICE QUESTION
30 sec • 1 pt
What is the final conclusion about the change in exam scores with each absence?
Each absence increases the score by 2 points.
Each absence has no effect on the score.
Each absence decreases the score by 2 points.
Each absence decreases the score by 3 points.
Access all questions and much more by creating a free account
Create resources
Host any resource
Get auto-graded reports
Continue with Google

Continue with Email
Continue with Classlink
Continue with Clever
or continue with
Microsoft
%20(1).png)
Apple
Others
Already have an account?
