Graphing Proportional Relationships
Interactive Video
•
Mathematics
•
6th - 7th Grade
•
Practice Problem
•
Hard

Olivia Brooks
FREE Resource
Read more
6 questions
Show all answers
1.
MULTIPLE CHOICE QUESTION
30 sec • 1 pt
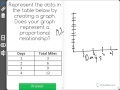
What is placed on the x-axis when setting up the graph?
Miles
Days
Hours
Kilometers
2.
MULTIPLE CHOICE QUESTION
30 sec • 1 pt
Which axis represents the total miles in the graph?
W-axis
Y-axis
Z-axis
X-axis
3.
MULTIPLE CHOICE QUESTION
30 sec • 1 pt
What is the second point plotted on the graph?
(1,3)
(2,6)
(3,9)
(4,12)
4.
MULTIPLE CHOICE QUESTION
30 sec • 1 pt
Which of the following points is not plotted on the graph?
(4,12)
(2,6)
(1,3)
(3,8)
5.
MULTIPLE CHOICE QUESTION
30 sec • 1 pt
What characteristic of the graph indicates a proportional relationship?
A line that does not pass through the origin
A straight line through the origin
A zigzag line
A curved line
6.
MULTIPLE CHOICE QUESTION
30 sec • 1 pt
If a graph has a straight line that does not pass through the origin, what does it indicate?
A proportional relationship
A non-proportional relationship
An exponential relationship
A logarithmic relationship
Access all questions and much more by creating a free account
Create resources
Host any resource
Get auto-graded reports
Continue with Google

Continue with Email
Continue with Classlink
Continue with Clever
or continue with
Microsoft
%20(1).png)
Apple
Others
Already have an account?
Popular Resources on Wayground

15 questions
Fractions on a Number Line
Quiz
•
3rd Grade
20 questions
Equivalent Fractions
Quiz
•
3rd Grade
25 questions
Multiplication Facts
Quiz
•
5th Grade
22 questions
fractions
Quiz
•
3rd Grade
20 questions
Main Idea and Details
Quiz
•
5th Grade
20 questions
Context Clues
Quiz
•
6th Grade
15 questions
Equivalent Fractions
Quiz
•
4th Grade
20 questions
Figurative Language Review
Quiz
•
6th Grade
Discover more resources for Mathematics
20 questions
Exponents
Quiz
•
6th Grade
22 questions
distributive property
Quiz
•
7th Grade
15 questions
Distributive Property & Review
Quiz
•
6th Grade
20 questions
Writing Algebraic Expressions
Quiz
•
6th Grade
20 questions
Ratios/Rates and Unit Rates
Quiz
•
6th Grade
20 questions
Writing and Graphing Inequalities
Quiz
•
6th Grade
10 questions
Unit Rate
Quiz
•
6th Grade
20 questions
Graphing Inequalities on a Number Line
Quiz
•
6th - 9th Grade