
Understanding Lines of Best Fit

Interactive Video
•
Mathematics
•
9th - 10th Grade
•
Practice Problem
•
Hard

Olivia Brooks
FREE Resource
Read more
5 questions
Show all answers
1.
MULTIPLE CHOICE QUESTION
30 sec • 1 pt
What is the primary purpose of a line of best fit in a scatter plot?
To highlight the outliers in the data
To connect all data points directly
To approximate the trend of the data
To provide an exact prediction for each data point
2.
MULTIPLE CHOICE QUESTION
30 sec • 1 pt
When drawing a line of best fit, what is a key consideration?
It should be as far from the data points as possible
It should pass through every data point
It should pass through the center of the data
It should only pass through the highest data point
3.
MULTIPLE CHOICE QUESTION
30 sec • 1 pt
Which of the following is true about the line of best fit?
It should only pass through the lowest data point
It should be parallel to the x-axis
It should have equal numbers of points above and below it
It must pass through the origin
4.
MULTIPLE CHOICE QUESTION
30 sec • 1 pt
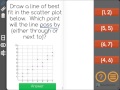
Which point does the line of best fit pass by in the given example?
(55, 55)
(1, 2)
(46, 46)
(67, 67)
5.
MULTIPLE CHOICE QUESTION
30 sec • 1 pt
Why might a line of best fit not pass through any data points?
Because it is drawn randomly
Because it only considers the highest data point
Because it is an exact representation of the data
Because it is an approximation of the data trend
Access all questions and much more by creating a free account
Create resources
Host any resource
Get auto-graded reports

Continue with Google

Continue with Email

Continue with Classlink

Continue with Clever
or continue with

Microsoft
%20(1).png)
Apple

Others
Already have an account?

