Water Bottle Pricing and Graphs
Interactive Video
•
Mathematics
•
5th - 6th Grade
•
Practice Problem
•
Hard

Liam Anderson
FREE Resource
Read more
5 questions
Show all answers
1.
MULTIPLE CHOICE QUESTION
30 sec • 1 pt
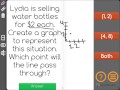
What is the price of one water bottle that Lydia is selling?
$4
$3
$2
$1
2.
MULTIPLE CHOICE QUESTION
30 sec • 1 pt
Which axis is used to represent the number of water bottles in the graph?
w-axis
x-axis
z-axis
y-axis
3.
MULTIPLE CHOICE QUESTION
30 sec • 1 pt
What is the price for two water bottles according to the graph setup?
$5
$4
$3
$2
4.
MULTIPLE CHOICE QUESTION
30 sec • 1 pt
Which of the following points does the line pass through on the graph?
(3, 5)
(5, 10)
(2, 3)
(1, 2)
5.
MULTIPLE CHOICE QUESTION
30 sec • 1 pt
What is the correct conclusion about the points the line passes through?
Only (1, 2)
Only (4, 8)
Both (1, 2) and (4, 8)
Neither (1, 2) nor (4, 8)
Access all questions and much more by creating a free account
Create resources
Host any resource
Get auto-graded reports
Continue with Google

Continue with Email
Continue with Classlink
Continue with Clever
or continue with
Microsoft
%20(1).png)
Apple
Others
Already have an account?
