Analyzing Speed and Distance Graphs
Interactive Video
•
Mathematics
•
6th - 7th Grade
•
Practice Problem
•
Hard

Emma Peterson
FREE Resource
Read more
8 questions
Show all answers
1.
MULTIPLE CHOICE QUESTION
30 sec • 1 pt
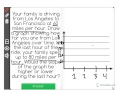
What is the initial speed of the family as they travel from Los Angeles to San Francisco?
80 MPH
70 MPH
60 MPH
50 MPH
2.
MULTIPLE CHOICE QUESTION
30 sec • 1 pt
Which axis is used to represent time in the graph?
X-axis
None of the above
Y-axis
Z-axis
3.
MULTIPLE CHOICE QUESTION
30 sec • 1 pt
What is the distance covered after 2 hours at a constant speed of 60 MPH?
240 miles
120 miles
60 miles
180 miles
4.
MULTIPLE CHOICE QUESTION
30 sec • 1 pt
How does the graph appear when the speed is constant at 60 MPH?
Straight line
Curved line
Dotted line
Zigzag line
5.
MULTIPLE CHOICE QUESTION
30 sec • 1 pt
What is the new speed during the last hour of the journey?
60 MPH
70 MPH
80 MPH
90 MPH
6.
MULTIPLE CHOICE QUESTION
30 sec • 1 pt
How does the slope of the graph change during the last hour?
It becomes steeper
It remains the same
It disappears
It becomes flatter
7.
MULTIPLE CHOICE QUESTION
30 sec • 1 pt
What is the total distance covered by the end of the fourth hour?
180 miles
300 miles
260 miles
240 miles
Access all questions and much more by creating a free account
Create resources
Host any resource
Get auto-graded reports
Continue with Google

Continue with Email
Continue with Microsoft
or continue with

%20(1).png)
Apple
Others
Already have an account?
