Understanding Tally Marks and Graphs
Interactive Video
•
Mathematics
•
1st - 3rd Grade
•
Practice Problem
•
Hard

Lucas Foster
Used 1+ times
FREE Resource
Read more
10 questions
Show all answers
1.
MULTIPLE CHOICE QUESTION
30 sec • 1 pt
What is the primary purpose of using tally marks?
To write stories
To solve equations
To make drawings
To organize data
2.
MULTIPLE CHOICE QUESTION
30 sec • 1 pt
How many tally marks represent the number 13?
One group of five and eight more
Two groups of five and three more
Three groups of five
Four groups of five
3.
MULTIPLE CHOICE QUESTION
30 sec • 1 pt
In the animal tally chart, how many elephants are there?
Seven
Eight
Six
Five
4.
MULTIPLE CHOICE QUESTION
30 sec • 1 pt
What is the correct tally mark representation for eight monkeys?
Three groups of five
One group of five and two more
One group of five and three more
Two groups of five
5.
MULTIPLE CHOICE QUESTION
30 sec • 1 pt
How many roosters are represented in the bird bar graph?
Seven
Five
Nine
Three
6.
MULTIPLE CHOICE QUESTION
30 sec • 1 pt
Which bird category has the highest number in the bar graph?
Ducks
Chicks
Roosters
Chickens
7.
MULTIPLE CHOICE QUESTION
30 sec • 1 pt
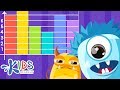
Who is the tallest alien in the bar graph?
Sally
Omar
Paul
Zack
Access all questions and much more by creating a free account
Create resources
Host any resource
Get auto-graded reports
Continue with Google

Continue with Email
Continue with Microsoft
or continue with

%20(1).png)
Apple
Others
Already have an account?
