Graphing Linear Functions and Properties
Interactive Video
•
Mathematics
•
9th - 10th Grade
•
Practice Problem
•
Hard

Thomas White
FREE Resource
Read more
16 questions
Show all answers
1.
MULTIPLE CHOICE QUESTION
30 sec • 1 pt
What is a piecewise function primarily composed of?
A function with a single variable
A constant function
A single function with no constraints
A group of functions with constraints
2.
MULTIPLE CHOICE QUESTION
30 sec • 1 pt
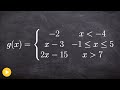
For the function G(x) = -2, what is the constraint on x?
x > -4
x = -4
x >= -4
x < -4
3.
MULTIPLE CHOICE QUESTION
30 sec • 1 pt
How does the graph of G(x) = -2 appear on the XY plane?
A vertical line at x = -2
A horizontal line at y = -2
A diagonal line with slope 1
A curve
4.
MULTIPLE CHOICE QUESTION
30 sec • 1 pt
What is the y-intercept of the function G(x) = x - 3?
0
-3
3
1
5.
MULTIPLE CHOICE QUESTION
30 sec • 1 pt
What is the slope of the function G(x) = x - 3?
0
1
-1
2
6.
MULTIPLE CHOICE QUESTION
30 sec • 1 pt
For the function G(x) = x - 3, what is the range of x?
-1 < x < 5
x < -1
-1 <= x <= 5
x > 5
7.
MULTIPLE CHOICE QUESTION
30 sec • 1 pt
What is the y-intercept of the function G(x) = 2x - 15?
-15
2
15
0
Access all questions and much more by creating a free account
Create resources
Host any resource
Get auto-graded reports
Continue with Google

Continue with Email
Continue with Classlink
Continue with Clever
or continue with
Microsoft
%20(1).png)
Apple
Others
Already have an account?
Popular Resources on Wayground

15 questions
Fractions on a Number Line
Quiz
•
3rd Grade
20 questions
Equivalent Fractions
Quiz
•
3rd Grade
25 questions
Multiplication Facts
Quiz
•
5th Grade
54 questions
Analyzing Line Graphs & Tables
Quiz
•
4th Grade
22 questions
fractions
Quiz
•
3rd Grade
20 questions
Main Idea and Details
Quiz
•
5th Grade
20 questions
Context Clues
Quiz
•
6th Grade
15 questions
Equivalent Fractions
Quiz
•
4th Grade
Discover more resources for Mathematics
20 questions
Graphing Inequalities on a Number Line
Quiz
•
6th - 9th Grade
18 questions
SAT Prep: Ratios, Proportions, & Percents
Quiz
•
9th - 10th Grade
12 questions
Exponential Growth and Decay
Quiz
•
9th Grade
12 questions
Parallel Lines Cut by a Transversal
Quiz
•
10th Grade
12 questions
Add and Subtract Polynomials
Quiz
•
9th - 12th Grade
15 questions
Combine Like Terms and Distributive Property
Quiz
•
8th - 9th Grade
20 questions
Function or Not a Function
Quiz
•
8th - 9th Grade
10 questions
Elijah McCoy: Innovations and Impact in Black History
Interactive video
•
6th - 10th Grade