Line of Best Fit and Scatterplots
Interactive Video
•
Mathematics
•
9th - 10th Grade
•
Practice Problem
•
Hard

Thomas White
FREE Resource
Read more
13 questions
Show all answers
1.
MULTIPLE CHOICE QUESTION
30 sec • 1 pt
What is the primary purpose of a scatterplot?
To calculate the average of data sets
To display the frequency of data points
To compare two unrelated variables
To show the relationship between different sets of data
2.
MULTIPLE CHOICE QUESTION
30 sec • 1 pt
In the basketball team example, what does the x-axis represent?
Number of points scored
Number of games played
Number of team members
Number of additional practice hours
3.
MULTIPLE CHOICE QUESTION
30 sec • 1 pt
What kind of relationship is shown in the basketball team's scatterplot?
Non-linear relationship
Linear relationship
No relationship
Inverse relationship
4.
MULTIPLE CHOICE QUESTION
30 sec • 1 pt
What is the purpose of constructing a line of best fit?
To summarize the relationship of the data
To include every data point
To eliminate outliers
To create a perfect prediction model
5.
MULTIPLE CHOICE QUESTION
30 sec • 1 pt
How is a line of best fit drawn on a scatterplot?
By connecting all data points
By ensuring equal points above and below the line
By drawing a horizontal line
By drawing a vertical line
6.
MULTIPLE CHOICE QUESTION
30 sec • 1 pt
What can the line of best fit help predict?
Potential outcomes not shown in the graph
The number of data points
Exact future outcomes
The relationship between unrelated variables
7.
MULTIPLE CHOICE QUESTION
30 sec • 1 pt
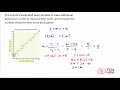
What form is used to find the equation of the line of best fit?
Slope-intercept form
Logarithmic form
Quadratic form
Exponential form
Access all questions and much more by creating a free account
Create resources
Host any resource
Get auto-graded reports
Continue with Google

Continue with Email
Continue with Microsoft
or continue with

%20(1).png)
Apple
Others
Already have an account?
