- Resource Library
- Math
- Probability And Statistics
- Central Limit Theorem
- Sampling Distribution And Central Limit Theorem
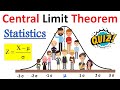
Sampling Distribution and Central Limit Theorem
Interactive Video
•
Mathematics
•
9th - 10th Grade
•
Practice Problem
•
Medium

Thomas White
Used 3+ times
FREE Resource
Read more
35 questions
Show all answers
1.
MULTIPLE CHOICE QUESTION
30 sec • 1 pt
What is the main topic of the video?
Law of Large Numbers
Central Limit Theorem
Probability Theory
Descriptive Statistics
2.
MULTIPLE CHOICE QUESTION
30 sec • 1 pt
What is a sample in statistics?
A large group representing a subset
A small group representing a population
A random selection of data points
A complete set of data
3.
MULTIPLE CHOICE QUESTION
30 sec • 1 pt
What does the Central Limit Theorem state about sample means?
They remain constant regardless of sample size
They follow the distribution of the population
They approach a normal distribution as sample size increases
They always follow a uniform distribution
4.
MULTIPLE CHOICE QUESTION
30 sec • 1 pt
When does the Central Limit Theorem apply?
When sample size is less than 30
When sample size is less than 10
When sample size is exactly 30
When sample size is greater than 30
5.
MULTIPLE CHOICE QUESTION
30 sec • 1 pt
What is the significance of the Central Limit Theorem?
It is only useful for small sample sizes
It describes the exact shape of the population distribution
It allows inference about population parameters without knowing the population distribution
It only applies to normally distributed populations
6.
MULTIPLE CHOICE QUESTION
30 sec • 1 pt
What is the relationship between sample mean and population mean according to the Central Limit Theorem?
Sample mean is unrelated
Sample mean is always less
Sample mean is always greater
Sample mean approximates population mean
7.
MULTIPLE CHOICE QUESTION
30 sec • 1 pt
What is the shape of the sampling distribution when n is less than 30?
Normal distribution
Same as population distribution
Uniform distribution
Bimodal distribution
Access all questions and much more by creating a free account
Create resources
Host any resource
Get auto-graded reports
Continue with Google

Continue with Email
Continue with Microsoft
or continue with

%20(1).png)
Apple
Others
Already have an account?
