Graphing Inequalities and Slope Concepts
Interactive Video
•
Mathematics
•
9th - 10th Grade
•
Practice Problem
•
Hard

Thomas White
FREE Resource
Read more
11 questions
Show all answers
1.
MULTIPLE CHOICE QUESTION
30 sec • 1 pt
What is the first step in graphing an inequality?
Find the x-intercept.
Shade the region above the line.
Graph it as a line, ignoring the inequality symbol.
Determine the slope.
2.
MULTIPLE CHOICE QUESTION
30 sec • 1 pt
In the equation y = mx + b, what does 'b' represent?
The slope of the line.
The x-intercept.
The y-intercept.
The point where the line crosses the x-axis.
3.
MULTIPLE CHOICE QUESTION
30 sec • 1 pt
How do you find the y-intercept on a graph?
Calculate the slope.
Use the midpoint formula.
Find the constant term in the equation.
Locate where the line crosses the x-axis.
4.
MULTIPLE CHOICE QUESTION
30 sec • 1 pt
What does the slope of a line indicate?
The midpoint of the line.
The x-intercept of the line.
The y-intercept of the line.
The steepness and direction of the line.
5.
MULTIPLE CHOICE QUESTION
30 sec • 1 pt
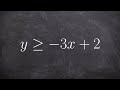
If the slope is -3, how do you plot the next point from the y-intercept?
Go down 3 units and left 1 unit.
Go up 3 units and left 1 unit.
Go down 3 units and right 1 unit.
Go up 3 units and right 1 unit.
6.
MULTIPLE CHOICE QUESTION
30 sec • 1 pt
What type of line is used for 'greater than or equal to' inequalities?
Dashed line.
Dotted line.
Curved line.
Solid line.
7.
MULTIPLE CHOICE QUESTION
30 sec • 1 pt
Why is shading important in graphing inequalities?
It highlights the y-intercept.
It indicates the solution region.
It shows the slope of the line.
It marks the x-intercept.
Access all questions and much more by creating a free account
Create resources
Host any resource
Get auto-graded reports
Continue with Google

Continue with Email
Continue with Classlink
Continue with Clever
or continue with
Microsoft
%20(1).png)
Apple
Others
Already have an account?
