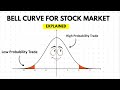
Understanding the Bell Curve in Trading
Interactive Video
•
Mathematics
•
9th - 10th Grade
•
Practice Problem
•
Hard

Thomas White
FREE Resource
Read more
9 questions
Show all answers
1.
MULTIPLE CHOICE QUESTION
30 sec • 1 pt
What is one of the key uses of the bell curve in understanding the world around us?
Predicting weather patterns
Estimating stock market behavior
Determining historical events
Calculating tax rates
2.
MULTIPLE CHOICE QUESTION
30 sec • 1 pt
In the example of arranging people by height, where do the tallest individuals fall on the axis?
Top
Right side
Middle
Left side
3.
MULTIPLE CHOICE QUESTION
30 sec • 1 pt
What does the mean represent in a bell curve?
The total number of occurrences
The most common occurrence
The least likely occurrence
The average deviation
4.
MULTIPLE CHOICE QUESTION
30 sec • 1 pt
Why is it unlikely to meet someone who is seven feet tall according to the bell curve?
Because they are not plotted on the curve
Because they are in the middle of the curve
Because they fall on the extreme right of the curve
Because they are not considered in the mean
5.
MULTIPLE CHOICE QUESTION
30 sec • 1 pt
How can the bell curve be applied in everyday life?
To predict the weather
To calculate tax rates
To estimate exam scores
To determine historical events
6.
MULTIPLE CHOICE QUESTION
30 sec • 1 pt
How do traders use the bell curve in the stock market?
To calculate tax rates
To determine company profits
To take high probability trades
To speculate on future prices
7.
MULTIPLE CHOICE QUESTION
30 sec • 1 pt
What do traders analyze to make high probability trades?
Future stock predictions
Global economic conditions
Past performance of a stock
Current market trends
Access all questions and much more by creating a free account
Create resources
Host any resource
Get auto-graded reports
Continue with Google

Continue with Email
Continue with Classlink
Continue with Clever
or continue with
Microsoft
%20(1).png)
Apple
Others
Already have an account?
