Understanding Stem and Leaf Plots
Interactive Video
•
Mathematics
•
6th - 8th Grade
•
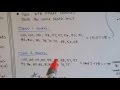
Practice Problem
•
Hard

Thomas White
FREE Resource
Read more
11 questions
Show all answers
1.
MULTIPLE CHOICE QUESTION
30 sec • 1 pt
What is the primary purpose of a stem and leaf plot?
To display data in a pie chart
To organize data using place value
To calculate the average of data
To compare data using bar graphs
2.
MULTIPLE CHOICE QUESTION
30 sec • 1 pt
In a stem and leaf plot, where are the tens place values placed?
In the leaves
In the stems
In the title
In the footnotes
3.
MULTIPLE CHOICE QUESTION
30 sec • 1 pt
What is a back-to-back stem and leaf plot used for?
To calculate the mean of data
To organize data in descending order
To compare two different groups of data
To display a single set of data
4.
MULTIPLE CHOICE QUESTION
30 sec • 1 pt
How many students took the test in each class?
15
18
20
25
5.
MULTIPLE CHOICE QUESTION
30 sec • 1 pt
What was the mean score for Class 1?
100
83.72
91.5
88
6.
MULTIPLE CHOICE QUESTION
30 sec • 1 pt
What was the mode for Class 1's scores?
97
72
100
85
7.
MULTIPLE CHOICE QUESTION
30 sec • 1 pt
What was the mean score for Class 2?
83.72
91.5
88
100
Access all questions and much more by creating a free account
Create resources
Host any resource
Get auto-graded reports
Continue with Google

Continue with Email
Continue with Microsoft
or continue with

%20(1).png)
Apple
Others
Already have an account?
