Understanding Function Domains and Graphs
Interactive Video
•
Mathematics
•
9th - 10th Grade
•
Practice Problem
•
Hard

Thomas White
FREE Resource
Read more
15 questions
Show all answers
1.
MULTIPLE CHOICE QUESTION
30 sec • 1 pt
What is the domain of a function?
The set of all possible output values
The set of all negative numbers
The set of all positive numbers
The set of all possible input values
2.
MULTIPLE CHOICE QUESTION
30 sec • 1 pt
How do you determine the domain of a function with a denominator?
Set the denominator not equal to zero
Set the numerator equal to zero
Set the numerator not equal to zero
Set the denominator equal to zero
3.
MULTIPLE CHOICE QUESTION
30 sec • 1 pt
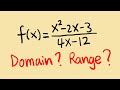
What is the restriction in the domain of the function 4x - 12?
x cannot be equal to 12
x cannot be equal to 0
x cannot be equal to 3
x cannot be equal to 4
4.
MULTIPLE CHOICE QUESTION
30 sec • 1 pt
Why is determining the range of a function often more complex than determining the domain?
Because it requires graphing
Because it involves understanding the behavior of the function
Because it requires factoring
Because it involves solving equations
5.
MULTIPLE CHOICE QUESTION
30 sec • 1 pt
What happens when you factor and cancel terms in a function?
The function becomes a quadratic
The function simplifies and may have restrictions
The function becomes a constant
The function becomes undefined
6.
MULTIPLE CHOICE QUESTION
30 sec • 1 pt
What is the significance of the open circle in the graph of a function?
It indicates a point where the function is minimum
It indicates a point where the function is maximum
It indicates a point where the function is zero
It indicates a point where the function is undefined
7.
MULTIPLE CHOICE QUESTION
30 sec • 1 pt
What is the slope of the line when the function is graphed?
1/4
1/3
1/2
1
Access all questions and much more by creating a free account
Create resources
Host any resource
Get auto-graded reports
Continue with Google

Continue with Email
Continue with Classlink
Continue with Clever
or continue with
Microsoft
%20(1).png)
Apple
Others
Already have an account?
Popular Resources on Wayground

7 questions
History of Valentine's Day
Interactive video
•
4th Grade
15 questions
Fractions on a Number Line
Quiz
•
3rd Grade
20 questions
Equivalent Fractions
Quiz
•
3rd Grade
25 questions
Multiplication Facts
Quiz
•
5th Grade
22 questions
fractions
Quiz
•
3rd Grade
15 questions
Valentine's Day Trivia
Quiz
•
3rd Grade
20 questions
Main Idea and Details
Quiz
•
5th Grade
20 questions
Context Clues
Quiz
•
6th Grade
Discover more resources for Mathematics
20 questions
Graphing Inequalities on a Number Line
Quiz
•
6th - 9th Grade
20 questions
Exponent Properties
Quiz
•
9th Grade
15 questions
Combine Like Terms and Distributive Property
Quiz
•
8th - 9th Grade
20 questions
Function or Not a Function
Quiz
•
8th - 9th Grade
10 questions
Factor Quadratic Expressions with Various Coefficients
Quiz
•
9th - 12th Grade
10 questions
Elijah McCoy: Innovations and Impact in Black History
Interactive video
•
6th - 10th Grade
21 questions
Factoring Trinomials (a=1)
Quiz
•
9th Grade
5 questions
Triangle Congruence Theorems
Interactive video
•
9th - 12th Grade