- Resource Library
- Math
- Probability And Statistics
- Normal Distribution
- Normal Distribution Concepts And Applications
Normal Distribution Concepts and Applications
Interactive Video
•
Mathematics
•
9th - 10th Grade
•
Practice Problem
•
Medium

Thomas White
Used 6+ times
FREE Resource
Read more
15 questions
Show all answers
1.
MULTIPLE CHOICE QUESTION
30 sec • 1 pt
What is another name for a normal curve?
Bell curve
Linear curve
Exponential curve
Logarithmic curve
2.
MULTIPLE CHOICE QUESTION
30 sec • 1 pt
Where can normal distributions commonly be found?
In art
In literature
In technology
In nature
3.
MULTIPLE CHOICE QUESTION
30 sec • 1 pt
What is located at the center of a normal distribution?
The mode
The median
The mean
The range
4.
MULTIPLE CHOICE QUESTION
30 sec • 1 pt
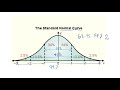
What percentage of data falls within one standard deviation in a normal distribution?
95%
50%
75%
68%
5.
MULTIPLE CHOICE QUESTION
30 sec • 1 pt
How much data is within two standard deviations in a normal distribution?
100%
68%
95%
99.7%
6.
MULTIPLE CHOICE QUESTION
30 sec • 1 pt
What percentage of data falls within three standard deviations?
100%
99.7%
95%
68%
7.
MULTIPLE CHOICE QUESTION
30 sec • 1 pt
In the example, what is the mean value identified?
54.2
66.5
12.3
99.7
Access all questions and much more by creating a free account
Create resources
Host any resource
Get auto-graded reports
Continue with Google

Continue with Email
Continue with Microsoft
or continue with

%20(1).png)
Apple
Others
Already have an account?
