- Resource Library
- Math
- Probability And Statistics
- Normal Distribution
- Understanding Normal Distribution Concepts
Understanding Normal Distribution Concepts
Interactive Video
•
Mathematics
•
9th - 10th Grade
•
Practice Problem
•
Hard

Thomas White
FREE Resource
Read more
8 questions
Show all answers
1.
MULTIPLE CHOICE QUESTION
30 sec • 1 pt
What is the primary shape of a normal distribution curve?
Bell-shaped
U-shaped
V-shaped
Flat
2.
MULTIPLE CHOICE QUESTION
30 sec • 1 pt
Which of the following is true about the normal curve?
It is flat
It is skewed to the left
It is symmetric on both sides
It is skewed to the right
3.
MULTIPLE CHOICE QUESTION
30 sec • 1 pt
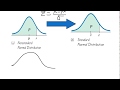
What differentiates a standard normal distribution from a non-standard one?
Mean is zero and standard deviation is one
Mean is one and standard deviation is zero
Mean is zero and standard deviation is two
Mean is two and standard deviation is one
4.
MULTIPLE CHOICE QUESTION
30 sec • 1 pt
What is a z-score used for in statistics?
To measure the height of a curve
To calculate the mean of a dataset
To find the median of a dataset
To convert a distribution to a standard normal distribution
5.
MULTIPLE CHOICE QUESTION
30 sec • 1 pt
In the example given, what is the z-score when X is 110, mean is 100, and standard deviation is 10?
2.0
1.5
1.0
0.5
6.
MULTIPLE CHOICE QUESTION
30 sec • 1 pt
What is a key characteristic of a standard normal distribution?
Mean is equal to the standard deviation
Mean is zero and standard deviation is one
Mean is one and standard deviation is zero
Mean and standard deviation are both zero
7.
MULTIPLE CHOICE QUESTION
30 sec • 1 pt
What percentage of data lies within three standard deviations of the mean in a normal distribution?
50%
68%
95%
99.7%
Access all questions and much more by creating a free account
Create resources
Host any resource
Get auto-graded reports
Continue with Google

Continue with Email
Continue with Classlink
Continue with Clever
or continue with
Microsoft
%20(1).png)
Apple
Others
Already have an account?
