Understanding Standard Deviation and Variance
Interactive Video
•
Mathematics
•
9th - 10th Grade
•
Practice Problem
•
Hard

Thomas White
FREE Resource
Read more
9 questions
Show all answers
1.
MULTIPLE CHOICE QUESTION
30 sec • 1 pt
What is the primary purpose of standard deviation in statistics?
To determine the mode of data
To measure the central tendency of data
To measure the spread of data
To calculate the average of data
2.
MULTIPLE CHOICE QUESTION
30 sec • 1 pt
In the context of classroom grades, what does a standard deviation of 10 points indicate?
The highest grade is 10 points
Grades are spread out by 10 points from the mean
All students scored 10 points
The average grade is 10 points
3.
MULTIPLE CHOICE QUESTION
30 sec • 1 pt
How does standard deviation differ from variance?
Variance is the square root of standard deviation
Variance is always larger than standard deviation
Standard deviation is the square root of variance
They are the same
4.
MULTIPLE CHOICE QUESTION
30 sec • 1 pt
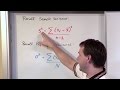
What is the formula for sample variance?
Sum of data points divided by the number of data points
Sum of squared differences from the mean divided by n-1
Sum of squared differences from the mean divided by n
Sum of data points minus the mean
5.
MULTIPLE CHOICE QUESTION
30 sec • 1 pt
What distinguishes population variance from sample variance?
Population variance uses n-1 in the denominator
Sample variance is always larger
Population variance uses n in the denominator
Sample variance uses n in the denominator
6.
MULTIPLE CHOICE QUESTION
30 sec • 1 pt
Why is squaring data points in variance calculation considered a limitation?
It makes calculations easier
It changes the units of measurement
It reduces the spread of data
It increases the mean value
7.
MULTIPLE CHOICE QUESTION
30 sec • 1 pt
What does a variance of 15 in classroom grades imply?
Grades are 15 points above the mean
Grades are 15 points below the mean
The spread of grades is squared
The spread of grades is 15 points squared
Access all questions and much more by creating a free account
Create resources
Host any resource
Get auto-graded reports
Continue with Google

Continue with Email
Continue with Microsoft
or continue with

%20(1).png)
Apple
Others
Already have an account?
