Graphing Inequalities and Budgeting Concepts
Interactive Video
•
Mathematics
•
9th - 10th Grade
•
Practice Problem
•
Hard

Thomas White
FREE Resource
Read more
23 questions
Show all answers
1.
MULTIPLE CHOICE QUESTION
30 sec • 1 pt
What is a viable solution in the context of inequalities?
A solution that satisfies only one inequality
A solution that satisfies all inequalities and makes sense contextually
A solution that only satisfies the mathematical conditions
A solution that is outside the shaded region
2.
MULTIPLE CHOICE QUESTION
30 sec • 1 pt
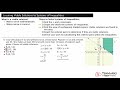
What is the first step in determining a viable solution graphically?
Drawing a random line on the graph
Finding the slope of the line
Identifying the x and y-intercepts
Calculating the midpoint of the line
3.
MULTIPLE CHOICE QUESTION
30 sec • 1 pt
How do you determine which side of the line to shade?
By using the inequality sign
By checking the slope of the line
By drawing a perpendicular line
By finding the midpoint of the line
4.
MULTIPLE CHOICE QUESTION
30 sec • 1 pt
What is the significance of the shaded region in a graph of inequalities?
It represents the area where no solutions exist
It shows the area where all solutions are viable
It indicates the boundary of the graph
It is irrelevant to finding solutions
5.
MULTIPLE CHOICE QUESTION
30 sec • 1 pt
How can you verify if a point is a viable solution?
By ensuring it is outside the shaded region
By substituting the point into the inequalities
By checking if it lies on the y-axis
By checking if it lies on the x-axis
6.
MULTIPLE CHOICE QUESTION
30 sec • 1 pt
What does it mean if a point falls outside the shaded region?
It is the midpoint of the line
It is the only solution
It is not a viable solution
It is a viable solution
7.
MULTIPLE CHOICE QUESTION
30 sec • 1 pt
What is the role of intercepts in graphing inequalities?
They indicate the midpoint of the line
They determine the slope of the line
They help in drawing the line on the graph
They are irrelevant to the graph
Access all questions and much more by creating a free account
Create resources
Host any resource
Get auto-graded reports
Continue with Google

Continue with Email
Continue with Classlink
Continue with Clever
or continue with
Microsoft
%20(1).png)
Apple
Others
Already have an account?
