Graphing Trends and Predictions
Interactive Video
•
Mathematics
•
6th - 7th Grade
•
Practice Problem
•
Hard

Thomas White
FREE Resource
Read more
15 questions
Show all answers
1.
MULTIPLE CHOICE QUESTION
30 sec • 1 pt
What is the primary purpose of using graphing in predictions?
To confuse students
To create colorful charts
To predict future trends
To replace mathematical calculations
2.
MULTIPLE CHOICE QUESTION
30 sec • 1 pt
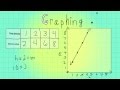
In the time and height graph, what is the height at one day?
Four
Three
Five
Two
3.
MULTIPLE CHOICE QUESTION
30 sec • 1 pt
What is the height at three days in the graph?
Four
Seven
Six
Five
4.
MULTIPLE CHOICE QUESTION
30 sec • 1 pt
How does the rate of change appear from day one to day three?
It decreases
It becomes horizontal
It remains constant
It increases significantly
5.
MULTIPLE CHOICE QUESTION
30 sec • 1 pt
What does the graph suggest about the trend after day three?
It will increase rapidly
It will become more horizontal
It will remain constant
It will decrease
6.
MULTIPLE CHOICE QUESTION
30 sec • 1 pt
In the hours and miles graph, what does 'H' represent?
Hours
Height
Hectares
Horses
7.
MULTIPLE CHOICE QUESTION
30 sec • 1 pt
What does 'M' stand for in the hours and miles graph?
Minutes
Millimeters
Miles
Meters
Access all questions and much more by creating a free account
Create resources
Host any resource
Get auto-graded reports
Continue with Google

Continue with Email
Continue with Classlink
Continue with Clever
or continue with
Microsoft
%20(1).png)
Apple
Others
Already have an account?
Popular Resources on Wayground

7 questions
History of Valentine's Day
Interactive video
•
4th Grade
15 questions
Fractions on a Number Line
Quiz
•
3rd Grade
20 questions
Equivalent Fractions
Quiz
•
3rd Grade
25 questions
Multiplication Facts
Quiz
•
5th Grade
22 questions
fractions
Quiz
•
3rd Grade
15 questions
Valentine's Day Trivia
Quiz
•
3rd Grade
20 questions
Main Idea and Details
Quiz
•
5th Grade
20 questions
Context Clues
Quiz
•
6th Grade
Discover more resources for Mathematics
20 questions
Writing Algebraic Expressions
Quiz
•
6th Grade
20 questions
Ratios/Rates and Unit Rates
Quiz
•
6th Grade
14 questions
Volume of rectangular prisms
Quiz
•
7th Grade
20 questions
Graphing Inequalities on a Number Line
Quiz
•
6th - 9th Grade
20 questions
One Step Equations
Quiz
•
6th Grade
10 questions
Solving One Step Inequalities
Quiz
•
6th Grade
15 questions
Equivalent Ratios
Quiz
•
6th Grade
16 questions
2022 Winter Olympics Medal Table
Passage
•
6th - 8th Grade