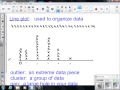
Understanding Line Plots Concepts
Interactive Video
•
Mathematics
•
6th - 7th Grade
•
Practice Problem
•
Hard

Thomas White
FREE Resource
Read more
16 questions
Show all answers
1.
MULTIPLE CHOICE QUESTION
30 sec • 1 pt
What is the primary purpose of a line plot?
To display data in a pie chart format
To compare data with bar graphs
To organize and visualize data
To calculate the average of data
2.
MULTIPLE CHOICE QUESTION
30 sec • 1 pt
How are data points represented in a line plot?
With circles
With triangles
With X's
With squares
3.
MULTIPLE CHOICE QUESTION
30 sec • 1 pt
Why is it important to keep X's the same size in a line plot?
To make the plot look neat
To ensure the plot is symmetrical
To easily identify the tallest column
To make the plot colorful
4.
MULTIPLE CHOICE QUESTION
30 sec • 1 pt
What can you easily find from a line plot?
The mean
The range
The mode
The median
5.
MULTIPLE CHOICE QUESTION
30 sec • 1 pt
How can you identify a mode in a line plot?
By identifying the first column of X's
By looking for the smallest column of X's
By counting the total number of X's
By finding the tallest column of X's
6.
MULTIPLE CHOICE QUESTION
30 sec • 1 pt
What does a cluster in a line plot indicate?
An empty space in the plot
A group of data points close together
A data point that is far from others
A single data point
7.
MULTIPLE CHOICE QUESTION
30 sec • 1 pt
What does it mean if data is 'distributed' in a line plot?
Data is spread out evenly
Data is concentrated in one area
Data is missing
Data is only in one column
Access all questions and much more by creating a free account
Create resources
Host any resource
Get auto-graded reports
Continue with Google

Continue with Email
Continue with Microsoft
or continue with

%20(1).png)
Apple
Others
Already have an account?
