Interpreting Data with Graphs
Interactive Video
•
Mathematics
•
3rd - 5th Grade
•
Practice Problem
•
Hard

Thomas White
FREE Resource
Read more
15 questions
Show all answers
1.
MULTIPLE CHOICE QUESTION
30 sec • 1 pt
What is the main topic Alex introduces in the session?
Learning music
Interpreting data
Playing soccer
Cooking recipes
2.
MULTIPLE CHOICE QUESTION
30 sec • 1 pt
Who is the coach that helps explore interpreting data?
Coach Brooklyn
Coach Mia
Coach Alex
Coach Daisy
3.
MULTIPLE CHOICE QUESTION
30 sec • 1 pt
What type of graphs does Coach Daisy introduce?
Bar graphs and pictographs
Line graphs and pie charts
Histograms and scatter plots
Flowcharts and diagrams
4.
MULTIPLE CHOICE QUESTION
30 sec • 1 pt
What does each bar in the bar graph represent?
A different player on the soccer team
A different coach
A different soccer team
A different sport
5.
MULTIPLE CHOICE QUESTION
30 sec • 1 pt
What is the first step in solving a problem using a bar graph?
Count the bars
Ignore the graph
Look at the title and scale
Guess the answer
6.
MULTIPLE CHOICE QUESTION
30 sec • 1 pt
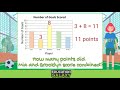
How many points did Mia score according to the bar graph?
10 points
8 points
3 points
5 points
7.
MULTIPLE CHOICE QUESTION
30 sec • 1 pt
What is the total number of points scored by Mia and Brooklyn combined?
10 points
15 points
11 points
8 points
Access all questions and much more by creating a free account
Create resources
Host any resource
Get auto-graded reports
Continue with Google

Continue with Email
Continue with Microsoft
or continue with

%20(1).png)
Apple
Others
Already have an account?
