Understanding Slope from Tables
Interactive Video
•
Mathematics
•
6th - 7th Grade
•
Practice Problem
•
Hard

Thomas White
FREE Resource
Read more
15 questions
Show all answers
1.
MULTIPLE CHOICE QUESTION
30 sec • 1 pt
What is the formula for calculating the slope?
Change in x over change in y
Product of x and y
Sum of x and y
Change in y over change in x
2.
MULTIPLE CHOICE QUESTION
30 sec • 1 pt
What is the first step in determining the slope from a table?
Multiply all x values
Find the sum of all y values
Subtract the smallest x from the largest x
Calculate the change in y and x between two points
3.
MULTIPLE CHOICE QUESTION
30 sec • 1 pt
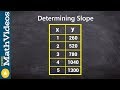
What is the change in y when moving from point 1 to point 2?
260
520
780
1040
4.
MULTIPLE CHOICE QUESTION
30 sec • 1 pt
What is the change in x when moving from point 1 to point 2?
0
3
2
1
5.
MULTIPLE CHOICE QUESTION
30 sec • 1 pt
What is the slope calculated from the first two points?
390
260
130
520
6.
MULTIPLE CHOICE QUESTION
30 sec • 1 pt
What is the change in y when moving from point 2 to point 3?
780
1040
260
520
7.
MULTIPLE CHOICE QUESTION
30 sec • 1 pt
What is the change in x when moving from point 2 to point 3?
3
2
1
0
Access all questions and much more by creating a free account
Create resources
Host any resource
Get auto-graded reports
Continue with Google

Continue with Email
Continue with Microsoft
or continue with

%20(1).png)
Apple
Others
Already have an account?
