- Resource Library
- Math
- Probability And Statistics
- Box And Whisker Plot
- Understanding Box And Whisker Plots
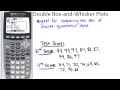
Understanding Box and Whisker Plots
Interactive Video
•
Mathematics
•
10th - 11th Grade
•
Practice Problem
•
Hard

Thomas White
FREE Resource
Read more
21 questions
Show all answers
1.
MULTIPLE CHOICE QUESTION
30 sec • 1 pt
What is the primary purpose of using double box and whisker plots?
To compare two sets of similar discrete quantitative data
To display categorical data
To analyze qualitative data
To calculate averages
2.
MULTIPLE CHOICE QUESTION
30 sec • 1 pt
Which of the following is a key feature of double box and whisker plots?
They show the relationship between two variables
They are used for time series analysis
They display pie chart data
They provide a visual comparison of distributions
3.
MULTIPLE CHOICE QUESTION
30 sec • 1 pt
What is the first step in creating a double box and whisker plot using a calculator?
Calculating the mean of the data
Entering data into a spreadsheet
Going into stat edit and filling up two different lists
Drawing the plot manually
4.
MULTIPLE CHOICE QUESTION
30 sec • 1 pt
When entering data for a double box and whisker plot, what is important to remember?
Data must be entered in ascending order
Data can be entered in any order
Data must be entered in descending order
Data must be entered alphabetically
5.
MULTIPLE CHOICE QUESTION
30 sec • 1 pt
What should you do after entering data into the lists for a double box and whisker plot?
Tell the calculator to stat plots and select box and whisker plots
Save the data to a file
Turn on the calculator
Print the data
6.
MULTIPLE CHOICE QUESTION
30 sec • 1 pt
How do you ensure that both plots are box and whisker plots in the calculator?
Select the histogram option
Select the pie chart option
Select the line graph option
Select the box and whisker plot option
7.
MULTIPLE CHOICE QUESTION
30 sec • 1 pt
What is the purpose of adjusting the window settings in the calculator?
To add labels to the plots
To save the plots
To ensure the plots are visible
To change the color of the plots
Access all questions and much more by creating a free account
Create resources
Host any resource
Get auto-graded reports
Continue with Google

Continue with Email
Continue with Microsoft
or continue with

%20(1).png)
Apple
Others
Already have an account?
