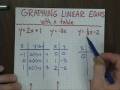
Graphing Linear Equations Concepts
Interactive Video
•
Mathematics
•
6th - 8th Grade
•
Practice Problem
•
Hard

Thomas White
FREE Resource
Read more
25 questions
Show all answers
1.
MULTIPLE CHOICE QUESTION
30 sec • 1 pt
What is the primary goal when graphing linear equations using a table of values?
To find the slope of the line
To determine the y-intercept
To connect points with a straight line
To calculate the area under the line
2.
MULTIPLE CHOICE QUESTION
30 sec • 1 pt
What are the two variables typically used in a table of values for linear equations?
p and q
x and y
a and b
m and n
3.
MULTIPLE CHOICE QUESTION
30 sec • 1 pt
Why is it beneficial to include a zero when choosing x values?
It helps in finding the slope
It is required for all equations
It simplifies calculations
It always results in a positive y value
4.
MULTIPLE CHOICE QUESTION
30 sec • 1 pt
What is the y value when x is -1 in the equation y = 2x + 1?
-3
-1
0
1
5.
MULTIPLE CHOICE QUESTION
30 sec • 1 pt
What is the y value when x is 0 in the equation y = 2x + 1?
0
1
2
-1
6.
MULTIPLE CHOICE QUESTION
30 sec • 1 pt
What is the y value when x is 1 in the equation y = 2x + 1?
1
2
3
4
7.
MULTIPLE CHOICE QUESTION
30 sec • 1 pt
What is the y value when x is 1 in the equation y = -3x?
0
-1
-3
3
Access all questions and much more by creating a free account
Create resources
Host any resource
Get auto-graded reports
Continue with Google

Continue with Email
Continue with Classlink
Continue with Clever
or continue with
Microsoft
%20(1).png)
Apple
Others
Already have an account?
Popular Resources on Wayground

15 questions
Fractions on a Number Line
Quiz
•
3rd Grade
20 questions
Equivalent Fractions
Quiz
•
3rd Grade
25 questions
Multiplication Facts
Quiz
•
5th Grade
22 questions
fractions
Quiz
•
3rd Grade
20 questions
Main Idea and Details
Quiz
•
5th Grade
20 questions
Context Clues
Quiz
•
6th Grade
15 questions
Equivalent Fractions
Quiz
•
4th Grade
20 questions
Figurative Language Review
Quiz
•
6th Grade
Discover more resources for Mathematics
20 questions
Exponents
Quiz
•
6th Grade
22 questions
distributive property
Quiz
•
7th Grade
15 questions
Distributive Property & Review
Quiz
•
6th Grade
20 questions
Writing Algebraic Expressions
Quiz
•
6th Grade
20 questions
Ratios/Rates and Unit Rates
Quiz
•
6th Grade
20 questions
Writing and Graphing Inequalities
Quiz
•
6th Grade
15 questions
Product of Powers Property A1 U7
Quiz
•
8th Grade
20 questions
Laws of Exponents
Quiz
•
8th Grade