- Resource Library
- Math
- Probability And Statistics
- Relative Frequency
- Relative Frequency And Survey Analysis
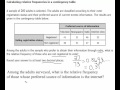
Relative Frequency and Survey Analysis
Interactive Video
•
Mathematics
•
9th - 10th Grade
•
Practice Problem
•
Hard

Thomas White
FREE Resource
Read more
8 questions
Show all answers
1.
MULTIPLE CHOICE QUESTION
30 sec • 1 pt
What is the primary focus of a contingency table?
To display data and identify relationships
To calculate averages
To list all survey participants
To predict future trends
2.
MULTIPLE CHOICE QUESTION
30 sec • 1 pt
In the given problem, how many adults were surveyed?
320
200
260
300
3.
MULTIPLE CHOICE QUESTION
30 sec • 1 pt
What is the relative frequency of radio listeners who are not registered voters?
0.57
0.27
0.37
0.47
4.
MULTIPLE CHOICE QUESTION
30 sec • 1 pt
How do you calculate the relative frequency of a group?
Subtract the group number from the total
Divide the total number by the group number
Divide the group number by the total number
Multiply the group number by the total
5.
MULTIPLE CHOICE QUESTION
30 sec • 1 pt
What percentage of the surveyed adults preferred the internet as their information source?
21%
37%
27%
31%
6.
MULTIPLE CHOICE QUESTION
30 sec • 1 pt
In the new dataset, what is the focus of the analysis?
All residents with any degree
Suburban residents with high school diplomas
Urban residents without college degrees
Rural residents with college degrees
7.
MULTIPLE CHOICE QUESTION
30 sec • 1 pt
How many urban residents without a college degree were surveyed?
47
57
67
77
Access all questions and much more by creating a free account
Create resources
Host any resource
Get auto-graded reports
Continue with Google

Continue with Email
Continue with Microsoft
or continue with

%20(1).png)
Apple
Others
Already have an account?
