Understanding Balance Points and Means
Interactive Video
•
Mathematics
•
9th - 10th Grade
•
Practice Problem
•
Hard

Thomas White
FREE Resource
Read more
21 questions
Show all answers
1.
MULTIPLE CHOICE QUESTION
30 sec • 1 pt
What is the main concept introduced in the textbook regarding the mean?
Mean as a midpoint
Mean as a balancing point
Mean as a frequency
Mean as a deviation
2.
MULTIPLE CHOICE QUESTION
30 sec • 1 pt
Why does the teacher feel uncomfortable with the visualization of the mean as a balancing point?
It is too complex
It is not visually appealing
It is not mathematically accurate
It is not helpful for future learning
3.
MULTIPLE CHOICE QUESTION
30 sec • 1 pt
What is the first step in calculating the mean of a dataset?
Finding the median
Summing up all the values
Finding the mode
Counting the number of values
4.
MULTIPLE CHOICE QUESTION
30 sec • 1 pt
What is the mean of the dataset: 4, 5, 7, 8, 11?
9
8
7
6
5.
MULTIPLE CHOICE QUESTION
30 sec • 1 pt
Why is it important that the mean is a nice even number in the example?
It is a rule in statistics
It simplifies calculations
It makes visualization easier
It is required for statistical analysis
6.
MULTIPLE CHOICE QUESTION
30 sec • 1 pt
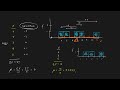
How is each score represented in the histogram visualization?
As a block
As a curve
As a line
As a point
7.
MULTIPLE CHOICE QUESTION
30 sec • 1 pt
What does the balance point in the histogram represent?
The median of the dataset
The mean of the dataset
The mode of the dataset
The highest frequency
Access all questions and much more by creating a free account
Create resources
Host any resource
Get auto-graded reports
Continue with Google

Continue with Email
Continue with Classlink
Continue with Clever
or continue with
Microsoft
%20(1).png)
Apple
Others
Already have an account?
