Understanding Box Plots and Outliers
Interactive Video
•
Mathematics
•
9th - 10th Grade
•
Practice Problem
•
Hard

Thomas White
FREE Resource
Read more
16 questions
Show all answers
1.
MULTIPLE CHOICE QUESTION
30 sec • 1 pt
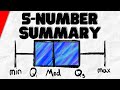
What are the components of a five number summary?
Minimum, maximum, mean, mode, and range
Minimum, first quartile, median, third quartile, and maximum
First quartile, median, third quartile, mean, and mode
Mean, median, mode, range, and standard deviation
2.
MULTIPLE CHOICE QUESTION
30 sec • 1 pt
What is the first step in finding the five number summary of a data set?
Determine the range
Find the mode
Order the data from least to greatest
Calculate the mean
3.
MULTIPLE CHOICE QUESTION
30 sec • 1 pt
How is the median determined in an even data set?
By selecting the highest number
By averaging the two middle numbers
By choosing the middle number
By selecting the lowest number
4.
MULTIPLE CHOICE QUESTION
30 sec • 1 pt
What is the median of the lower half of the data called?
Q1
Median
Q3
Minimum
5.
MULTIPLE CHOICE QUESTION
30 sec • 1 pt
What is the median of the upper half of the data called?
Q3
Median
Maximum
Q1
6.
MULTIPLE CHOICE QUESTION
30 sec • 1 pt
What is the purpose of a box plot?
To find the mode
To display the mean and standard deviation
To calculate the range
To show the distribution of data using the five number summary
7.
MULTIPLE CHOICE QUESTION
30 sec • 1 pt
What do the whiskers in a box plot represent?
The minimum and maximum values
The first and third quartiles
The mean and median
The range of the data
Access all questions and much more by creating a free account
Create resources
Host any resource
Get auto-graded reports
Continue with Google

Continue with Email
Continue with Microsoft
or continue with

%20(1).png)
Apple
Others
Already have an account?
