Inequalities and Their Solutions
Interactive Video
•
Mathematics
•
9th - 10th Grade
•
Practice Problem
•
Hard

Thomas White
FREE Resource
Read more
23 questions
Show all answers
1.
MULTIPLE CHOICE QUESTION
30 sec • 1 pt
What is the main difference between an equation and an inequality?
An equation shows equivalence, while an inequality shows a range of values.
An equation is always true, while an inequality is always false.
An equation has variables, while an inequality does not.
An equation is solved graphically, while an inequality is solved algebraically.
2.
MULTIPLE CHOICE QUESTION
30 sec • 1 pt
If X is greater than or equal to 3, which of the following is NOT a possible value for X?
4
2.999
3.001
3
3.
MULTIPLE CHOICE QUESTION
30 sec • 1 pt
What is the first step in solving the inequality X^2 + 6X < -5?
Multiply both sides by 2
Subtract 6X from both sides
Add 5 to both sides
Divide both sides by X
4.
MULTIPLE CHOICE QUESTION
30 sec • 1 pt
When solving X^2 + 6X < -5, what are the solutions after factoring?
X = 2 and X = 3
X = 0 and X = 6
X = -1 and X = -5
X = 1 and X = 5
5.
MULTIPLE CHOICE QUESTION
30 sec • 1 pt
How do you determine which sections of the number line satisfy the inequality?
By solving for X in each section
By testing a point from each section
By graphing the inequality
By using a calculator
6.
MULTIPLE CHOICE QUESTION
30 sec • 1 pt
What is the solution to the inequality X^2 + 6X < -5?
From -5 to -1, inclusive
From -5 to -1, exclusive
From -1 to 5, inclusive
From -1 to 5, exclusive
7.
MULTIPLE CHOICE QUESTION
30 sec • 1 pt
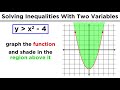
When graphing Y ≥ X + 2, what does the shaded region represent?
Points on and below the line
Points below the line
Points on the line
Points above the line
Access all questions and much more by creating a free account
Create resources
Host any resource
Get auto-graded reports
Continue with Google

Continue with Email
Continue with Classlink
Continue with Clever
or continue with
Microsoft
%20(1).png)
Apple
Others
Already have an account?
Popular Resources on Wayground

7 questions
History of Valentine's Day
Interactive video
•
4th Grade
15 questions
Fractions on a Number Line
Quiz
•
3rd Grade
20 questions
Equivalent Fractions
Quiz
•
3rd Grade
25 questions
Multiplication Facts
Quiz
•
5th Grade
22 questions
fractions
Quiz
•
3rd Grade
15 questions
Valentine's Day Trivia
Quiz
•
3rd Grade
20 questions
Main Idea and Details
Quiz
•
5th Grade
20 questions
Context Clues
Quiz
•
6th Grade
Discover more resources for Mathematics
20 questions
Graphing Inequalities on a Number Line
Quiz
•
6th - 9th Grade
20 questions
Exponent Properties
Quiz
•
9th Grade
15 questions
Combine Like Terms and Distributive Property
Quiz
•
8th - 9th Grade
20 questions
Function or Not a Function
Quiz
•
8th - 9th Grade
10 questions
Factor Quadratic Expressions with Various Coefficients
Quiz
•
9th - 12th Grade
10 questions
Elijah McCoy: Innovations and Impact in Black History
Interactive video
•
6th - 10th Grade
21 questions
Factoring Trinomials (a=1)
Quiz
•
9th Grade
5 questions
Triangle Congruence Theorems
Interactive video
•
9th - 12th Grade