- Resource Library
- Math
- Probability And Statistics
- Curve Of Best Fit
- Analyzing Quadratic Functions And Data Trends
Analyzing Quadratic Functions and Data Trends
Interactive Video
•
Mathematics
•
9th - 10th Grade
•
Practice Problem
•
Hard

Thomas White
FREE Resource
Read more
19 questions
Show all answers
1.
MULTIPLE CHOICE QUESTION
30 sec • 1 pt
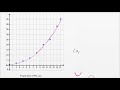
What does the scatterplot in the video represent?
Average annual global high fructose corn syrup consumption from 1970 to 1985
Average annual U.S. per-capita consumption of high fructose corn syrup from 1970 to 1985
Average annual global sugar consumption from 1980 to 2000
Average annual U.S. per-capita consumption of sugar from 1990 to 2005
2.
MULTIPLE CHOICE QUESTION
30 sec • 1 pt
What type of curve is suggested to fit the scatterplot data?
A straight line
A parabola
A cubic curve
An exponential curve
3.
MULTIPLE CHOICE QUESTION
30 sec • 1 pt
What does the term 'curve of best fit' refer to?
A curve that best represents the overall trend of the data
A curve that is always a straight line
A curve that is the simplest to draw
A curve that passes through all data points
4.
MULTIPLE CHOICE QUESTION
30 sec • 1 pt
Why might a parabola be a better fit for certain data sets than a straight line?
It is more visually appealing
It always fits all data points
It is easier to calculate
It can represent non-linear trends
5.
MULTIPLE CHOICE QUESTION
30 sec • 1 pt
What is the significance of the coefficient on the highest degree term in a quadratic function?
It determines the width of the parabola
It affects the direction in which the parabola opens
It changes the color of the graph
It has no impact on the graph
6.
MULTIPLE CHOICE QUESTION
30 sec • 1 pt
Which of the following is NOT a characteristic of a quadratic function?
It has a constant rate of change
It includes a squared term
It can open upwards or downwards
It is represented by a parabola
7.
MULTIPLE CHOICE QUESTION
30 sec • 1 pt
How can you identify a quadratic function from its equation?
It has no constant term
It has a cubic term
It includes a squared term
It has a linear term
Access all questions and much more by creating a free account
Create resources
Host any resource
Get auto-graded reports
Continue with Google

Continue with Email
Continue with Microsoft
or continue with

%20(1).png)
Apple
Others
Already have an account?
