- Resource Library
- Math
- Probability And Statistics
- Shapes Of Distributions
- Understanding Data Distributions And Measures
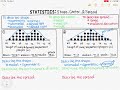
Understanding Data Distributions and Measures
Interactive Video
•
Mathematics
•
9th - 10th Grade
•
Practice Problem
•
Medium

Thomas White
Used 1+ times
FREE Resource
Read more
11 questions
Show all answers
1.
MULTIPLE CHOICE QUESTION
30 sec • 1 pt
What are the three main aspects used to describe a data distribution?
Shape, Center, Spread
Mean, Median, Mode
Range, Variance, Skewness
Peaks, Tails, Symmetry
2.
MULTIPLE CHOICE QUESTION
30 sec • 1 pt
What does a bimodal distribution indicate?
No peaks
Three peaks
One peak
Two peaks
3.
MULTIPLE CHOICE QUESTION
30 sec • 1 pt
What is a key characteristic of a normal distribution?
Multimodal and asymmetric
Bimodal and skewed
Unimodal and skewed
Unimodal and symmetric
4.
MULTIPLE CHOICE QUESTION
30 sec • 1 pt
In a skewed right distribution, where is the tail located?
On the right side
On the left side
No tail
In the center
5.
MULTIPLE CHOICE QUESTION
30 sec • 1 pt
What does a skewed left distribution look like?
Symmetric
Tail on the right
No tail
Tail on the left
6.
MULTIPLE CHOICE QUESTION
30 sec • 1 pt
Which measure of center is not suitable for bimodal distributions?
Mode
Range
Mean
Median
7.
MULTIPLE CHOICE QUESTION
30 sec • 1 pt
For a normal distribution, which measures of center can be used?
Mean, Median, Mode
Mode only
Median only
Mean only
Access all questions and much more by creating a free account
Create resources
Host any resource
Get auto-graded reports
Continue with Google

Continue with Email
Continue with Classlink
Continue with Clever
or continue with
Microsoft
%20(1).png)
Apple
Others
Already have an account?
Similar Resources on Wayground

11 questions
Understanding Algebra and Geometry Concepts
Interactive video
•
9th - 10th Grade
11 questions
Transformations of Quadrilaterals
Interactive video
•
9th - 10th Grade
11 questions
Graphing Techniques and Data Representation
Interactive video
•
9th - 10th Grade
11 questions
A Beginner's Guide to Graphing Data
Interactive video
•
9th - 10th Grade
11 questions
Graphing Trigonometric Functions with Polynomials
Interactive video
•
9th - 10th Grade
11 questions
Cyclic Quadrilaterals and Sine Properties
Interactive video
•
9th - 10th Grade
8 questions
Sebastian Wernicke: Lies, damned lies and statistics (about TEDTalks)
Interactive video
•
9th - 10th Grade
11 questions
Understanding Frequency and Data Analysis
Interactive video
•
9th - 10th Grade
Popular Resources on Wayground
15 questions
Fractions on a Number Line
Quiz
•
3rd Grade
20 questions
Equivalent Fractions
Quiz
•
3rd Grade
25 questions
Multiplication Facts
Quiz
•
5th Grade
29 questions
Alg. 1 Section 5.1 Coordinate Plane
Quiz
•
9th Grade
22 questions
fractions
Quiz
•
3rd Grade
11 questions
FOREST Effective communication
Lesson
•
KG
20 questions
Main Idea and Details
Quiz
•
5th Grade
20 questions
Context Clues
Quiz
•
6th Grade
Discover more resources for Mathematics
29 questions
Alg. 1 Section 5.1 Coordinate Plane
Quiz
•
9th Grade
20 questions
Graphing Inequalities on a Number Line
Quiz
•
6th - 9th Grade
20 questions
Box and Whisker Plots
Quiz
•
9th Grade
18 questions
Exponential Growth and Decay
Quiz
•
9th Grade
20 questions
Function or Not a Function
Quiz
•
8th - 9th Grade
20 questions
SSS/SAS
Quiz
•
9th - 12th Grade
14 questions
Making Inferences From Samples
Quiz
•
7th - 12th Grade
23 questions
CCG - CH8 Polygon angles and area Review
Quiz
•
9th - 12th Grade