Estimating Area Under Curves
Interactive Video
•
Mathematics
•
9th - 10th Grade
•
Practice Problem
•
Hard

Thomas White
FREE Resource
Read more
22 questions
Show all answers
1.
MULTIPLE CHOICE QUESTION
30 sec • 1 pt
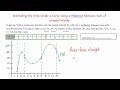
What is the main topic of the video presented by mathcamp321?
Calculating derivatives
Finding the slope of a line
Estimating area under a curve using midpoint Riemann sum
Solving quadratic equations
2.
MULTIPLE CHOICE QUESTION
30 sec • 1 pt
Why is it important to know the type of Riemann sum you are working with?
Because different types are used for different functions
Because it affects the calculation of derivatives
Because it is crucial for solving AP test problems correctly
Because it determines the method of integration
3.
MULTIPLE CHOICE QUESTION
30 sec • 1 pt
What is the interval given in the problem statement for the function f(x)?
From 0 to 5
From 2 to 13
From 3 to 15
From 1 to 10
4.
MULTIPLE CHOICE QUESTION
30 sec • 1 pt
How many sub-intervals are used in the midpoint Riemann sum in this problem?
Five
Four
Three
Two
5.
MULTIPLE CHOICE QUESTION
30 sec • 1 pt
What is the first step in delineating the intervals?
Calculating the area
Using vertical dotted lines
Plotting the function
Drawing horizontal lines
6.
MULTIPLE CHOICE QUESTION
30 sec • 1 pt
Which point is plotted first on the table?
(4, 15)
(3, 20)
(2, 5)
(6.5, 10)
7.
MULTIPLE CHOICE QUESTION
30 sec • 1 pt
What is the purpose of connecting the plotted points with a smooth curve?
To calculate the derivative
To determine the maximum value
To find the slope
To visualize the function f(x)
Access all questions and much more by creating a free account
Create resources
Host any resource
Get auto-graded reports
Continue with Google

Continue with Email
Continue with Classlink
Continue with Clever
or continue with
Microsoft
%20(1).png)
Apple
Others
Already have an account?
Popular Resources on Wayground

8 questions
Spartan Way - Classroom Responsible
Quiz
•
9th - 12th Grade
15 questions
Fractions on a Number Line
Quiz
•
3rd Grade
14 questions
Boundaries & Healthy Relationships
Lesson
•
6th - 8th Grade
20 questions
Equivalent Fractions
Quiz
•
3rd Grade
3 questions
Integrity and Your Health
Lesson
•
6th - 8th Grade
25 questions
Multiplication Facts
Quiz
•
5th Grade
9 questions
FOREST Perception
Lesson
•
KG
20 questions
Main Idea and Details
Quiz
•
5th Grade
Discover more resources for Mathematics
20 questions
Graphing Inequalities on a Number Line
Quiz
•
6th - 9th Grade
11 questions
Adding and Subtracting Polynomials
Quiz
•
9th Grade
20 questions
Box and Whisker Plots
Quiz
•
9th Grade
18 questions
Exponential Growth and Decay
Quiz
•
9th Grade
12 questions
Equation of a Circle
Lesson
•
10th Grade
12 questions
Exponential Growth and Decay
Quiz
•
9th Grade
14 questions
Making Inferences From Samples
Quiz
•
7th - 12th Grade
24 questions
Solving Linear Equations with Variables on Both Sides
Quiz
•
9th Grade