Statistical Measures and Data Representation
Interactive Video
•
Mathematics
•
6th - 7th Grade
•
Practice Problem
•
Hard

Thomas White
FREE Resource
Read more
23 questions
Show all answers
1.
MULTIPLE CHOICE QUESTION
30 sec • 1 pt
What is the main topic of the video?
Pie Charts
Bar Graphs
Stem and Leaf Diagrams
Line Graphs
2.
MULTIPLE CHOICE QUESTION
30 sec • 1 pt
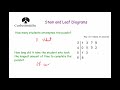
What does the key '3 | 1' represent in the diagram?
3.1 seconds
13 seconds
31 seconds
1.3 seconds
3.
MULTIPLE CHOICE QUESTION
30 sec • 1 pt
How many students completed the puzzle?
12
11
13
10
4.
MULTIPLE CHOICE QUESTION
30 sec • 1 pt
What does each leaf in the diagram represent?
A teacher
A pair of students
A single student
A group of students
5.
MULTIPLE CHOICE QUESTION
30 sec • 1 pt
What was the longest time taken by a student to complete the puzzle?
40 seconds
42 seconds
68 seconds
51 seconds
6.
MULTIPLE CHOICE QUESTION
30 sec • 1 pt
What was the shortest time taken by a student to complete the puzzle?
31 seconds
33 seconds
37 seconds
39 seconds
7.
MULTIPLE CHOICE QUESTION
30 sec • 1 pt
What is the significance of the number 68 in the diagram?
It is the shortest time
It is the mode
It is the median
It is the longest time
Access all questions and much more by creating a free account
Create resources
Host any resource
Get auto-graded reports
Continue with Google

Continue with Email
Continue with Classlink
Continue with Clever
or continue with
Microsoft
%20(1).png)
Apple
Others
Already have an account?
Popular Resources on Wayground

15 questions
Fractions on a Number Line
Quiz
•
3rd Grade
20 questions
Equivalent Fractions
Quiz
•
3rd Grade
25 questions
Multiplication Facts
Quiz
•
5th Grade
54 questions
Analyzing Line Graphs & Tables
Quiz
•
4th Grade
22 questions
fractions
Quiz
•
3rd Grade
20 questions
Main Idea and Details
Quiz
•
5th Grade
20 questions
Context Clues
Quiz
•
6th Grade
15 questions
Equivalent Fractions
Quiz
•
4th Grade
Discover more resources for Mathematics
22 questions
distributive property
Quiz
•
7th Grade
18 questions
Angle Relationships
Quiz
•
7th Grade
15 questions
Distributive Property & Review
Quiz
•
6th Grade
20 questions
Writing Algebraic Expressions
Quiz
•
6th Grade
20 questions
How Some Friendships Last — and Others Don’t Video Questions
Quiz
•
7th Grade
20 questions
Ratios/Rates and Unit Rates
Quiz
•
6th Grade
18 questions
Handbook Refresher Quiz
Quiz
•
7th Grade
20 questions
Graphing Inequalities on a Number Line
Quiz
•
6th - 9th Grade