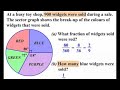
Widget Sales and Fractions
Interactive Video
•
Mathematics
•
6th - 7th Grade
•
Practice Problem
•
Hard

Thomas White
FREE Resource
Read more
20 questions
Show all answers
1.
MULTIPLE CHOICE QUESTION
30 sec • 1 pt
What is another name for sector graphs?
Pie charts
P graphs
Line graphs
Bar graphs
2.
MULTIPLE CHOICE QUESTION
30 sec • 1 pt
How many widgets were sold in total at the toy shop?
800
900
950
1000
3.
MULTIPLE CHOICE QUESTION
30 sec • 1 pt
What is the angle of the red sector in the graph?
60°
70°
80°
90°
4.
MULTIPLE CHOICE QUESTION
30 sec • 1 pt
What is the fraction of red widgets sold?
1/4
3/8
2/9
1/3
5.
MULTIPLE CHOICE QUESTION
30 sec • 1 pt
What is the first step in simplifying the fraction 80/360?
Multiply by 10
Divide by 2
Divide by 4
Cancel zeros
6.
MULTIPLE CHOICE QUESTION
30 sec • 1 pt
What is the simplified form of the fraction 8/36?
1/4
2/9
1/3
3/8
7.
MULTIPLE CHOICE QUESTION
30 sec • 1 pt
What fraction of the circle does the blue sector represent?
1/5
1/4
1/3
1/2
Access all questions and much more by creating a free account
Create resources
Host any resource
Get auto-graded reports
Continue with Google

Continue with Email
Continue with Classlink
Continue with Clever
or continue with
Microsoft
%20(1).png)
Apple
Others
Already have an account?
