Interpreting Circle Graphs and Percentages
Interactive Video
•
Mathematics
•
6th - 7th Grade
•
Practice Problem
•
Hard

Thomas White
FREE Resource
Read more
15 questions
Show all answers
1.
MULTIPLE CHOICE QUESTION
30 sec • 1 pt
What is the first step in interpreting a circle graph?
Multiply the percentage by the total number of people.
Divide the total number of people by the percentage.
Convert percentages or fractions to decimals.
Add all the percentages together.
2.
MULTIPLE CHOICE QUESTION
30 sec • 1 pt
Why is it important to convert percentages to decimals when interpreting circle graphs?
Decimals are easier to read.
Decimals are required for graph plotting.
Decimals allow for accurate calculations.
Decimals simplify the graph.
3.
MULTIPLE CHOICE QUESTION
30 sec • 1 pt
What do you do after converting percentages to decimals in circle graph interpretation?
Multiply the decimal by the total number of surveyed people.
Divide the decimal by the total number of surveyed people.
Add the decimals together.
Subtract the decimal from the total number of surveyed people.
4.
MULTIPLE CHOICE QUESTION
30 sec • 1 pt
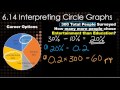
In the example problem, what percentage of people chose the medical profession?
30%
10%
40%
20%
5.
MULTIPLE CHOICE QUESTION
30 sec • 1 pt
How many people chose the medical profession if 300 people were surveyed and 30% chose it?
90
80
70
60
6.
MULTIPLE CHOICE QUESTION
30 sec • 1 pt
What is the percentage difference between entertainment and education in the example problem?
20%
40%
30%
10%
7.
MULTIPLE CHOICE QUESTION
30 sec • 1 pt
How many more people chose entertainment over education if the percentage difference is 20% and 300 people were surveyed?
80
70
60
50
Access all questions and much more by creating a free account
Create resources
Host any resource
Get auto-graded reports
Continue with Google

Continue with Email
Continue with Microsoft
or continue with

%20(1).png)
Apple
Others
Already have an account?
