Qualitative Graphs and Their Characteristics
Interactive Video
•
Mathematics
•
6th - 8th Grade
•
Practice Problem
•
Hard

Thomas White
FREE Resource
Read more
11 questions
Show all answers
1.
MULTIPLE CHOICE QUESTION
30 sec • 1 pt
What is the main objective of the lesson on qualitative graphs?
To calculate numerical values from graphs
To sketch and describe qualitative graphs
To memorize graph equations
To learn about quantitative graphs
2.
MULTIPLE CHOICE QUESTION
30 sec • 1 pt
During which periods did the percent of photos downloaded not change?
Between 0 and 2 seconds
Between 10 and 12 seconds
Between 4 and 6 seconds
Between 2 and 4 seconds
3.
MULTIPLE CHOICE QUESTION
30 sec • 1 pt
In the download example, when did the percent downloaded change the most?
Between 2 and 4 seconds
Between 6 and 8 seconds
Between 8 and 10 seconds
Between 0 and 2 seconds
4.
MULTIPLE CHOICE QUESTION
30 sec • 1 pt
What is the independent variable when plotting the download data?
Time
Percent downloaded
Number of photos
Download speed
5.
MULTIPLE CHOICE QUESTION
30 sec • 1 pt
What is a characteristic of qualitative graphs?
They are used for precise calculations
They are always linear
They represent situations without numerical values
They always include numerical values
6.
MULTIPLE CHOICE QUESTION
30 sec • 1 pt
In the bathtub example, what happens to the water level after it reaches a constant rate?
It remains constant
It fluctuates
It decreases
It increases
7.
MULTIPLE CHOICE QUESTION
30 sec • 1 pt
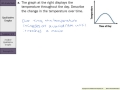
How does the temperature change over time in the temperature graph?
It increases at a constant rate
It decreases at a constant rate
It remains constant
It increases and decreases at varied rates
Access all questions and much more by creating a free account
Create resources
Host any resource
Get auto-graded reports
Continue with Google

Continue with Email
Continue with Microsoft
or continue with

%20(1).png)
Apple
Others
Already have an account?
