- Resource Library
- Math
- Probability And Statistics
- Confidence Interval
- Confidence Intervals And Hypothesis Testing
Confidence Intervals and Hypothesis Testing
Interactive Video
•
Mathematics
•
9th - 10th Grade
•
Practice Problem
•
Hard

Thomas White
FREE Resource
Read more
18 questions
Show all answers
1.
MULTIPLE CHOICE QUESTION
30 sec • 1 pt
What is the main focus of the video tutorial?
Hypothesis testing for a single population mean
Confidence intervals for the difference between two population means
Hypothesis testing for the difference between two population means
Confidence intervals for a single population mean
2.
MULTIPLE CHOICE QUESTION
30 sec • 1 pt
What is the purpose of a confidence interval?
To determine the sample size needed for a study
To test a hypothesis about a population parameter
To provide a range of values within which a population parameter is likely to fall
To estimate the exact value of a population parameter
3.
MULTIPLE CHOICE QUESTION
30 sec • 1 pt
What does the formula for a confidence interval include?
The ratio of two sample means
The product of two sample means
The difference between two sample means plus or minus a margin of error
The sum of two sample means
4.
MULTIPLE CHOICE QUESTION
30 sec • 1 pt
What is the margin of error in a confidence interval?
The standard deviation of the sample
The amount added or subtracted from the sample mean to create the interval
The range of values within which the true population parameter is expected to fall
The difference between the highest and lowest values in a data set
5.
MULTIPLE CHOICE QUESTION
30 sec • 1 pt
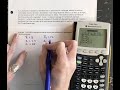
Which tool is used to calculate the confidence interval in the video?
A manual calculation
A spreadsheet program
A graphing calculator
A statistical software package
6.
MULTIPLE CHOICE QUESTION
30 sec • 1 pt
What type of test is used in the calculator for this example?
One-sample T test
Chi-square test
Two-sample T interval
Two-sample Z test
7.
MULTIPLE CHOICE QUESTION
30 sec • 1 pt
What is the confidence level used in the example?
85%
99%
95%
90%
Access all questions and much more by creating a free account
Create resources
Host any resource
Get auto-graded reports
Continue with Google

Continue with Email
Continue with Classlink
Continue with Clever
or continue with
Microsoft
%20(1).png)
Apple
Others
Already have an account?
Popular Resources on Wayground

15 questions
Fractions on a Number Line
Quiz
•
3rd Grade
20 questions
Equivalent Fractions
Quiz
•
3rd Grade
25 questions
Multiplication Facts
Quiz
•
5th Grade
29 questions
Alg. 1 Section 5.1 Coordinate Plane
Quiz
•
9th Grade
22 questions
fractions
Quiz
•
3rd Grade
11 questions
FOREST Effective communication
Lesson
•
KG
20 questions
Main Idea and Details
Quiz
•
5th Grade
20 questions
Context Clues
Quiz
•
6th Grade
Discover more resources for Mathematics
29 questions
Alg. 1 Section 5.1 Coordinate Plane
Quiz
•
9th Grade
20 questions
Graphing Inequalities on a Number Line
Quiz
•
6th - 9th Grade
20 questions
Box and Whisker Plots
Quiz
•
9th Grade
18 questions
Exponential Growth and Decay
Quiz
•
9th Grade
20 questions
Function or Not a Function
Quiz
•
8th - 9th Grade
20 questions
SSS/SAS
Quiz
•
9th - 12th Grade
14 questions
Making Inferences From Samples
Quiz
•
7th - 12th Grade
23 questions
CCG - CH8 Polygon angles and area Review
Quiz
•
9th - 12th Grade