Graphing Linear Equations and Points
Interactive Video
•
Mathematics
•
6th - 7th Grade
•
Practice Problem
•
Hard

Thomas White
FREE Resource
Read more
15 questions
Show all answers
1.
MULTIPLE CHOICE QUESTION
30 sec • 1 pt
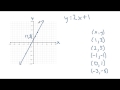
What is the equation of the line being graphed in the video?
y = x - 2
y = 3x - 1
y = x + 2
y = 2x + 1
2.
MULTIPLE CHOICE QUESTION
30 sec • 1 pt
What is the first step in graphing a line according to the video?
Find XY pairs that satisfy the equation
Calculate the y-intercept
Find the slope of the line
Draw the line directly
3.
MULTIPLE CHOICE QUESTION
30 sec • 1 pt
What is the Y value when X is 1 for the equation y = 2x + 1?
4
2
1
3
4.
MULTIPLE CHOICE QUESTION
30 sec • 1 pt
How do you plot the point (1, 3) on the graph?
Go right 3 and up 1
Go left 1 and up 3
Go left 3 and down 1
Go right 1 and up 3
5.
MULTIPLE CHOICE QUESTION
30 sec • 1 pt
What is the Y value when X is 2 for the equation y = 2x + 1?
6
4
3
5
6.
MULTIPLE CHOICE QUESTION
30 sec • 1 pt
How do you plot the point (2, 5) on the graph?
Go left 2 and up 5
Go right 2 and up 5
Go right 5 and up 2
Go left 5 and down 2
7.
MULTIPLE CHOICE QUESTION
30 sec • 1 pt
What is the Y value when X is -1 for the equation y = 2x + 1?
-1
0
2
1
Access all questions and much more by creating a free account
Create resources
Host any resource
Get auto-graded reports
Continue with Google

Continue with Email
Continue with Classlink
Continue with Clever
or continue with
Microsoft
%20(1).png)
Apple
Others
Already have an account?
Similar Resources on Wayground
Popular Resources on Wayground

7 questions
History of Valentine's Day
Interactive video
•
4th Grade
15 questions
Fractions on a Number Line
Quiz
•
3rd Grade
20 questions
Equivalent Fractions
Quiz
•
3rd Grade
25 questions
Multiplication Facts
Quiz
•
5th Grade
22 questions
fractions
Quiz
•
3rd Grade
15 questions
Valentine's Day Trivia
Quiz
•
3rd Grade
20 questions
Main Idea and Details
Quiz
•
5th Grade
20 questions
Context Clues
Quiz
•
6th Grade
Discover more resources for Mathematics
20 questions
Writing Algebraic Expressions
Quiz
•
6th Grade
20 questions
Ratios/Rates and Unit Rates
Quiz
•
6th Grade
14 questions
Volume of rectangular prisms
Quiz
•
7th Grade
20 questions
Graphing Inequalities on a Number Line
Quiz
•
6th - 9th Grade
20 questions
One Step Equations
Quiz
•
6th Grade
10 questions
Solving One Step Inequalities
Quiz
•
6th Grade
15 questions
Equivalent Ratios
Quiz
•
6th Grade
16 questions
2022 Winter Olympics Medal Table
Passage
•
6th - 8th Grade