Graphs of Rakes, Leaves, and Apples
Interactive Video
•
Mathematics
•
3rd - 4th Grade
•
Practice Problem
•
Hard

Thomas White
FREE Resource
Read more
15 questions
Show all answers
1.
MULTIPLE CHOICE QUESTION
30 sec • 1 pt
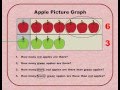
What is the purpose of the apple picture graph?
To illustrate the growth of apple trees
To compare the size of apples
To display the number of apples in different colors
To show the number of different fruits
2.
MULTIPLE CHOICE QUESTION
30 sec • 1 pt
How many red apples are shown in the graph?
Five
Six
Seven
Four
3.
MULTIPLE CHOICE QUESTION
30 sec • 1 pt
What is the total count of green apples in the graph?
Four
Five
Three
Two
4.
MULTIPLE CHOICE QUESTION
30 sec • 1 pt
How many more red apples are there compared to green apples?
Four
Three
Two
One
5.
MULTIPLE CHOICE QUESTION
30 sec • 1 pt
How many fewer green apples are there than red apples?
Four
Three
Two
One
6.
MULTIPLE CHOICE QUESTION
30 sec • 1 pt
What does the scarecrow and crow graph represent?
The number of scarecrows and crows
The number of birds in a field
The height of scarecrows
The types of crops in a field
7.
MULTIPLE CHOICE QUESTION
30 sec • 1 pt
How many scarecrows are depicted in the graph?
Three
Two
Four
One
Access all questions and much more by creating a free account
Create resources
Host any resource
Get auto-graded reports
Continue with Google

Continue with Email
Continue with Classlink
Continue with Clever
or continue with
Microsoft
%20(1).png)
Apple
Others
Already have an account?
