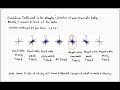
Correlation Analysis Concepts
Interactive Video
•
Mathematics
•
9th - 10th Grade
•
Practice Problem
•
Hard

Thomas White
FREE Resource
Read more
7 questions
Show all answers
1.
MULTIPLE CHOICE QUESTION
30 sec • 1 pt
What is the primary focus of correlation analysis?
To determine the cause of data trends
To measure the strength and direction of a relationship between two variables
To predict future data points
To calculate the average of data sets
2.
MULTIPLE CHOICE QUESTION
30 sec • 1 pt
What is the range of the correlation coefficient?
0 to 1
-0.5 to 0.5
-2 to 2
-1 to 1
3.
MULTIPLE CHOICE QUESTION
30 sec • 1 pt
What does a correlation coefficient of 1 indicate?
A weak positive correlation
A perfect negative correlation
A perfect positive correlation
No correlation
4.
MULTIPLE CHOICE QUESTION
30 sec • 1 pt
How is a positive trend represented in a graph?
A line going from top left to bottom right
A line going from bottom left to top right
A vertical line
A horizontal line
5.
MULTIPLE CHOICE QUESTION
30 sec • 1 pt
What does it mean when data points are tightly packed together?
The correlation is strong
There is no correlation
The data is random
The correlation is weak
6.
MULTIPLE CHOICE QUESTION
30 sec • 1 pt
What is indicated by a correlation coefficient of -0.8?
A weak negative trend
A strong negative trend
A weak positive trend
A strong positive trend
7.
MULTIPLE CHOICE QUESTION
30 sec • 1 pt
Why might the terms 'strong' and 'weak' vary across different fields?
Because different fields have different data sets
Because the terms are universally defined
Because the terms are subjective and context-dependent
Because some fields do not use correlation
Access all questions and much more by creating a free account
Create resources
Host any resource
Get auto-graded reports
Continue with Google

Continue with Email
Continue with Microsoft
or continue with

%20(1).png)
Apple
Others
Already have an account?
