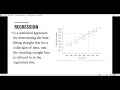
Correlation and Linear Regression Concepts
Interactive Video
•
Mathematics
•
9th - 10th Grade
•
Practice Problem
•
Hard

Thomas White
FREE Resource
Read more
7 questions
Show all answers
1.
MULTIPLE CHOICE QUESTION
30 sec • 1 pt
What is the primary purpose of the correlation coefficient?
To find the mode of a dataset.
To calculate the median of a dataset.
To determine the average of a dataset.
To measure the strength and direction of a linear relationship between two variables.
2.
MULTIPLE CHOICE QUESTION
30 sec • 1 pt
In a scatter plot, what does a negative linear correlation indicate?
The data points form a perfect circle.
There is no relationship between x and y.
As x increases, y tends to decrease.
As x increases, y tends to increase.
3.
MULTIPLE CHOICE QUESTION
30 sec • 1 pt
What does a correlation coefficient of 0 signify?
A perfect negative correlation.
A strong positive correlation.
A perfect positive correlation.
No correlation between the variables.
4.
MULTIPLE CHOICE QUESTION
30 sec • 1 pt
In the example provided, what is the relationship between the number of TV commercials aired and sales?
There is no relationship.
There is a strong positive correlation.
The relationship is weak and insignificant.
There is a strong negative correlation.
5.
MULTIPLE CHOICE QUESTION
30 sec • 1 pt
What is the purpose of linear regression?
To calculate the median of a dataset.
To determine the best-fitting straight line for a collection of data.
To find the average of a dataset.
To find the mode of a dataset.
6.
MULTIPLE CHOICE QUESTION
30 sec • 1 pt
How is the slope of the regression line calculated?
By subtracting the smallest value from the largest value.
By finding the average of x and y.
By using the formula involving the summation of x, y, and their squares.
By dividing the sum of x by the sum of y.
7.
MULTIPLE CHOICE QUESTION
30 sec • 1 pt
Using the regression line equation, what is the predicted sales value for 15 ads per week?
12.51 thousand pesos
16.51 thousand pesos
14.51 thousand pesos
10.51 thousand pesos
Access all questions and much more by creating a free account
Create resources
Host any resource
Get auto-graded reports
Continue with Google

Continue with Email
Continue with Classlink
Continue with Clever
or continue with
Microsoft
%20(1).png)
Apple
Others
Already have an account?
