Graph Types and Data Interpretation
Interactive Video
•
Mathematics
•
6th - 7th Grade
•
Practice Problem
•
Hard

Thomas White
FREE Resource
Read more
38 questions
Show all answers
1.
MULTIPLE CHOICE QUESTION
30 sec • 1 pt
What is the main focus of Chapter 10 in the video?
New concepts in mathematics
Advanced calculus techniques
Introduction to algebra
Review of organizing and displaying data
2.
MULTIPLE CHOICE QUESTION
30 sec • 1 pt
What type of graph is used to display data with vertical or horizontal bars?
Scatter plot
Bar graph
Circle graph
Line graph
3.
MULTIPLE CHOICE QUESTION
30 sec • 1 pt
Which ingredient in the sub sandwich example contains the most fat?
Bread
Ham
Mayonnaise
Turkey
4.
MULTIPLE CHOICE QUESTION
30 sec • 1 pt
How many more grams of fat are in ham compared to turkey in the example?
2 grams
3 grams
5 grams
4 grams
5.
MULTIPLE CHOICE QUESTION
30 sec • 1 pt
What is the total fat content of the sandwich in the example?
25 grams
28 grams
30 grams
32 grams
6.
MULTIPLE CHOICE QUESTION
30 sec • 1 pt
In a double bar graph, what is used to distinguish between two sets of data?
Different shapes
A legend or key
Different fonts
Different line styles
7.
MULTIPLE CHOICE QUESTION
30 sec • 1 pt
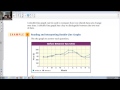
In which year did State College have the greatest basketball attendance?
2003
2002
2004
2001
Access all questions and much more by creating a free account
Create resources
Host any resource
Get auto-graded reports
Continue with Google

Continue with Email
Continue with Classlink
Continue with Clever
or continue with
Microsoft
%20(1).png)
Apple
Others
Already have an account?
Popular Resources on Wayground

15 questions
Fractions on a Number Line
Quiz
•
3rd Grade
20 questions
Equivalent Fractions
Quiz
•
3rd Grade
25 questions
Multiplication Facts
Quiz
•
5th Grade
22 questions
fractions
Quiz
•
3rd Grade
20 questions
Main Idea and Details
Quiz
•
5th Grade
20 questions
Context Clues
Quiz
•
6th Grade
15 questions
Equivalent Fractions
Quiz
•
4th Grade
20 questions
Figurative Language Review
Quiz
•
6th Grade
Discover more resources for Mathematics
20 questions
Exponents
Quiz
•
6th Grade
22 questions
distributive property
Quiz
•
7th Grade
15 questions
Distributive Property & Review
Quiz
•
6th Grade
20 questions
Writing Algebraic Expressions
Quiz
•
6th Grade
20 questions
Ratios/Rates and Unit Rates
Quiz
•
6th Grade
20 questions
Writing and Graphing Inequalities
Quiz
•
6th Grade
10 questions
Unit Rate
Quiz
•
6th Grade
20 questions
Graphing Inequalities on a Number Line
Quiz
•
6th - 9th Grade