Understanding Quartiles and Dot Plots
Interactive Video
•
Mathematics
•
6th - 8th Grade
•
Practice Problem
•
Hard

Thomas White
FREE Resource
Read more
31 questions
Show all answers
1.
MULTIPLE CHOICE QUESTION
30 sec • 1 pt
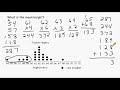
What is the primary focus of the video tutorial?
Dot plots
Pie charts
Line graphs
Bar charts
2.
MULTIPLE CHOICE QUESTION
30 sec • 1 pt
What does each dot in a dot plot represent?
A group of students
A single student
A pair of students
A class of students
3.
MULTIPLE CHOICE QUESTION
30 sec • 1 pt
How many observations are displayed in the dot plot?
26
24
22
20
4.
MULTIPLE CHOICE QUESTION
30 sec • 1 pt
What does the variable 'n' represent in statistics?
The mean
The median
The number of observations
The range
5.
MULTIPLE CHOICE QUESTION
30 sec • 1 pt
Why is knowing the number of observations important?
To identify outliers
To find the median and mean
To calculate the mode
To determine the range
6.
MULTIPLE CHOICE QUESTION
30 sec • 1 pt
What is the median height of the students?
61 inches
62 inches
63 inches
60 inches
7.
MULTIPLE CHOICE QUESTION
30 sec • 1 pt
How is the median determined when the number of observations is even?
By taking the average of the two middle values
By selecting the middle value
By choosing the lowest value
By choosing the highest value
Access all questions and much more by creating a free account
Create resources
Host any resource
Get auto-graded reports
Continue with Google

Continue with Email
Continue with Classlink
Continue with Clever
or continue with
Microsoft
%20(1).png)
Apple
Others
Already have an account?
Popular Resources on Wayground

7 questions
History of Valentine's Day
Interactive video
•
4th Grade
15 questions
Fractions on a Number Line
Quiz
•
3rd Grade
20 questions
Equivalent Fractions
Quiz
•
3rd Grade
25 questions
Multiplication Facts
Quiz
•
5th Grade
22 questions
fractions
Quiz
•
3rd Grade
15 questions
Valentine's Day Trivia
Quiz
•
3rd Grade
20 questions
Main Idea and Details
Quiz
•
5th Grade
20 questions
Context Clues
Quiz
•
6th Grade
Discover more resources for Mathematics
20 questions
Writing Algebraic Expressions
Quiz
•
6th Grade
20 questions
Ratios/Rates and Unit Rates
Quiz
•
6th Grade
14 questions
Volume of rectangular prisms
Quiz
•
7th Grade
20 questions
Laws of Exponents
Quiz
•
8th Grade
20 questions
Graphing Inequalities on a Number Line
Quiz
•
6th - 9th Grade
20 questions
One Step Equations
Quiz
•
6th Grade
10 questions
Solving One Step Inequalities
Quiz
•
6th Grade
15 questions
Equivalent Ratios
Quiz
•
6th Grade