Graphing Linear Inequalities Concepts
Interactive Video
•
Mathematics
•
9th - 10th Grade
•
Practice Problem
•
Hard

Thomas White
FREE Resource
Read more
10 questions
Show all answers
1.
MULTIPLE CHOICE QUESTION
30 sec • 1 pt
What is the first step in graphing a linear inequality?
Shade the graph
Determine the slope
Find the x-intercept
Convert the inequality to an equation
2.
MULTIPLE CHOICE QUESTION
30 sec • 1 pt
In the equation y = mx + b, what does 'b' represent?
The slope
The x-intercept
The y-intercept
The origin
3.
MULTIPLE CHOICE QUESTION
30 sec • 1 pt
How do you find the second point when graphing a line?
Use the origin
Use the y-intercept
Use the slope
Use the x-intercept
4.
MULTIPLE CHOICE QUESTION
30 sec • 1 pt
What determines if the line is solid or broken?
The x-intercept
The inequality symbol
The slope
The y-intercept
5.
MULTIPLE CHOICE QUESTION
30 sec • 1 pt
Which test point is commonly used to determine shading?
(0,0)
(2,2)
(-1,-1)
(1,1)
6.
MULTIPLE CHOICE QUESTION
30 sec • 1 pt
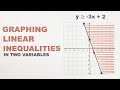
What is the inequality in the second example?
y ≥ -3x + 2
y > -3x + 2
y < -3/2x + 2
y ≤ -3/2x + 2
7.
MULTIPLE CHOICE QUESTION
30 sec • 1 pt
In the second example, what is the y-intercept?
2
1
0
-2
Access all questions and much more by creating a free account
Create resources
Host any resource
Get auto-graded reports
Continue with Google

Continue with Email
Continue with Classlink
Continue with Clever
or continue with
Microsoft
%20(1).png)
Apple
Others
Already have an account?
