Graphing Calculator Functions and Applications
Interactive Video
•
Mathematics
•
9th - 10th Grade
•
Practice Problem
•
Hard

Thomas White
FREE Resource
Read more
13 questions
Show all answers
1.
MULTIPLE CHOICE QUESTION
30 sec • 1 pt
What is the primary purpose of using a graphing calculator in the context of the video?
To plot and interpret data
To play games
To send emails
To browse the internet
2.
MULTIPLE CHOICE QUESTION
30 sec • 1 pt
In the soda bottle example, what does the X column represent?
The temperature
The number of seconds
The color of the bottle
The amount of soda
3.
MULTIPLE CHOICE QUESTION
30 sec • 1 pt
What is the first step in entering data into the graphing calculator?
Pressing the power button
Going to the stat menu and pressing enter
Adjusting the brightness
Connecting to Wi-Fi
4.
MULTIPLE CHOICE QUESTION
30 sec • 1 pt
What does the 'zoom stat' function do on the graphing calculator?
It changes the color of the graph
It adjusts the window to fit all data points
It prints the graph
It turns off the calculator
5.
MULTIPLE CHOICE QUESTION
30 sec • 1 pt
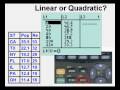
What type of relation does the curve in the soda bottle example resemble?
Linear
Quadratic
Exponential
Cubic
6.
MULTIPLE CHOICE QUESTION
30 sec • 1 pt
Why is it beneficial to use the calculator for entering the regression equation?
It saves time and reduces errors
It makes the graph colorful
It allows for internet browsing
It increases battery life
7.
MULTIPLE CHOICE QUESTION
30 sec • 1 pt
What feature allows you to make predictions using the graphing calculator?
The color settings
The trace function
The Wi-Fi connection
The power button
Access all questions and much more by creating a free account
Create resources
Host any resource
Get auto-graded reports
Continue with Google

Continue with Email
Continue with Classlink
Continue with Clever
or continue with
Microsoft
%20(1).png)
Apple
Others
Already have an account?
